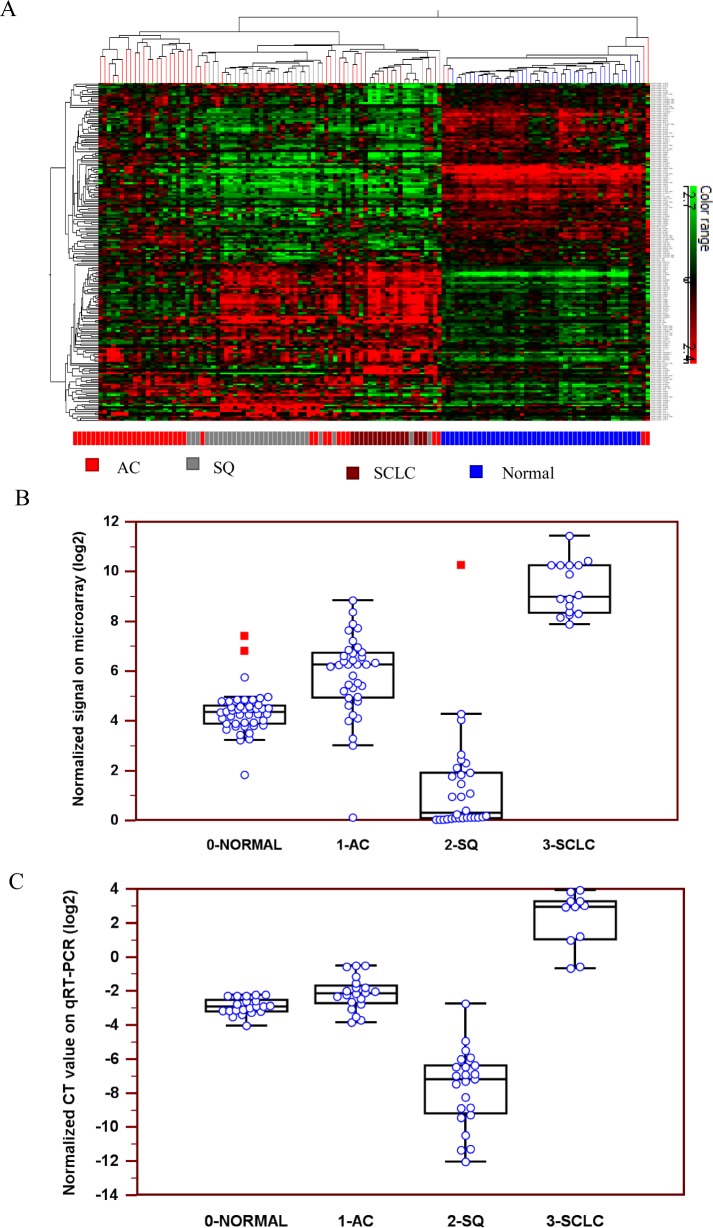
Fig 1. Expression profiles of miR-375 in 3 lung carcinoma subtypes.
A, Hierarchical clustering of miRNA expression profiles in AC, SQ, SCLC and normal lung tissue on microarrays. The mean signal from biological replicate samples was used for the clustering. Colored bars indicate the range of normalized log2-based signals. B, An interactive dot diagram of miR-375 normalized signals on microarrays. C, An interactive dot diagram of miR-375 normalized CT values on qRT-PCR. AC: adenocarcinoma, SQ: squamous cell carcinoma, SCLC: small cell lung carcinoma.

