
Fig 4. Biomarker changes relative to baseline (A, B, C) in the BBR1 study.
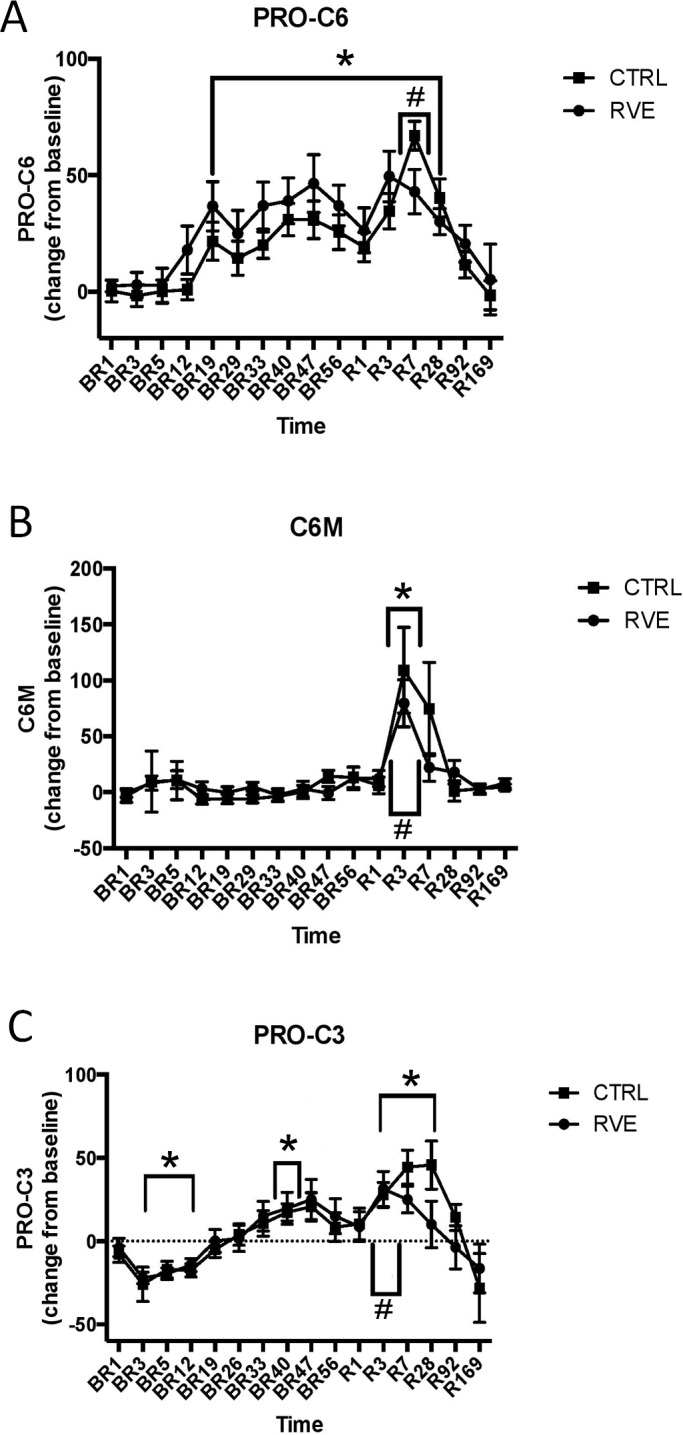
(A) Pro-C6 changes relative to baseline (%). (B) C6M changes relative to baseline (%). (C) Pro-C3 changes relative to baseline (%). “BR” time points denote bed rest immobilization time points and “R” time points denote remobilization time points. The number suffix denotes the number of days into the bed rest or remobilization period. “*” denotes the days that have significantly different levels when compared to baseline, p<0.05. “#” denotes significant difference in the level when compared to the last time point of the immobilization period (BR56), p<0.05. Data are expressed as means ±SEMs.