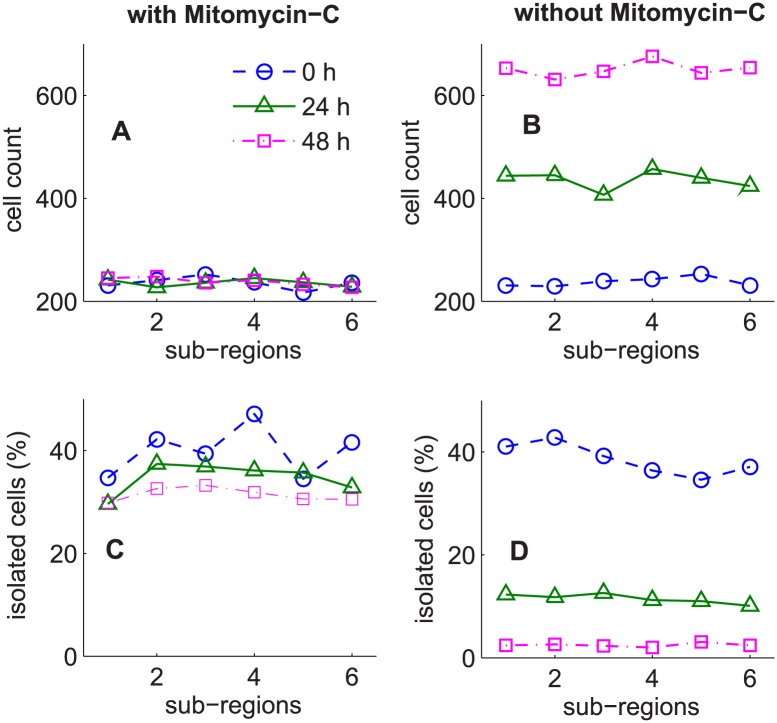
Fig 2. Cell counts and percentages of isolated cells.
Results correspond to experiments initiated with 20,000 cells. Subfigures A–B, C–D show the cell counts and the percentages of isolated cells for the six sub-regions after averaging over the three replicates, for the experiments with and without Mitomycin-C pre-treatment, respectively. The dashed line (circle markers), the solid line (triangle markers) and the dashed dotted line (square markers) correspond to the experiment at initial time, 0 h, terminated at 24 h and 48 h, respectively.

