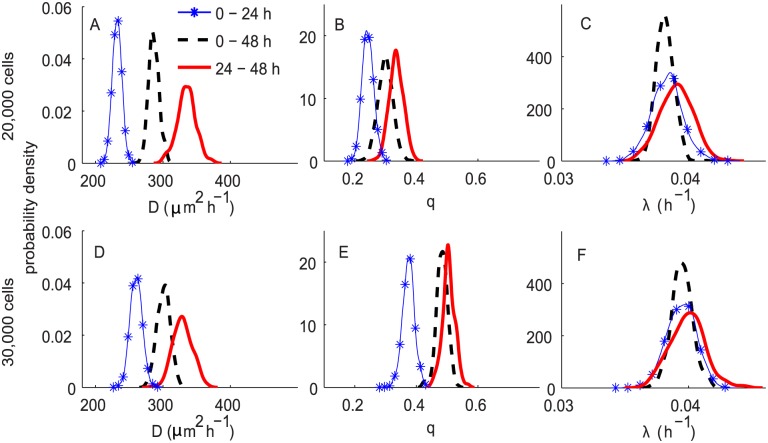
Fig 9. ABC posterior distributions for D, q and λ for experiments in Scenario 2, using informative priors for D, q and an uninformative prior for λ.
Subfigures A–C and D–F correspond to the ABC posterior estimates for the experiments initiated with 20,000 and 30,000 cells, respectively. In all subfigures, the blue curve with markers, the black dashed and the red solid curves represent the ABC posterior distribution for 0–24 h, 0–48 h and 24–48 h, respectively.

