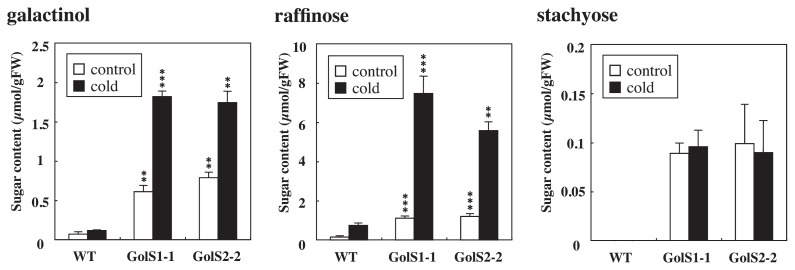
Fig. 4.
Galactinol, raffinose and stachyose contents of transgenic rice lines overexpressing TaGolS1 or TaGolS2 after cold treatment. Fourteen-day-old plants of wild-type (WT) and two independent transgenic lines (GolS 1-1 and GolS 2-2: T2 generation) were subjected to cold at 5°C under continuous light for 14 days. The third leaves were sampled from WT, GolS 1-1 and GolS 2-2 transgenic plants. Each data point represents the mean ± standard deviation from four individual plants. Bars labeled with asterisks show significant differences between WT and transgenic plants by Welch’s t-test at ** P = 0.01 and *** P = 0.001.

