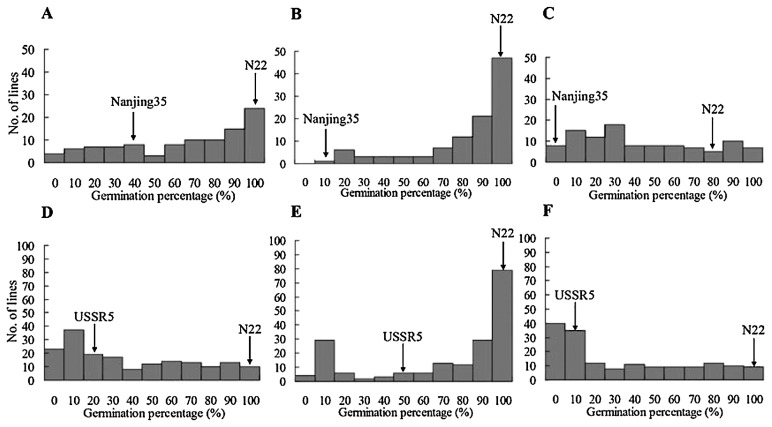
Fig. 2.
Frequency distributions of GPs after aging treatments in Nanjing35/N22//Nanjing35 BILs and USSR5/N22 RILs. (A–C) represent frequency distributions of GPs in Nanjing35/N22//Nanjing35 BILs after artificial aging for 35 days in 2010, natural aging for 32 months in 2009, and combined aging treatment in 2009, abbreviated as treatment B-A-10, B-N-09, and B-C-09, respectively. (D–F) represent frequency distributions of GPs in USSR5/N22 RILs after artificial aging for 38 days in 2012, natural aging for 32 months in 2009, and combined aging treatment in 2011, abbreviated as treatment R-A-12, R-N-09, and R-C-11, respectively. GPs of the parents are indicated by arrows.

