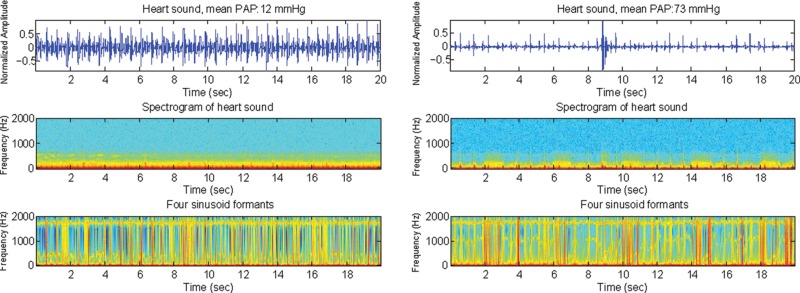
Figure 1.
Heart sound recordings (top), spectrograms (middle), and sine wave replicas that represent the 4 sinusoid formants (bottom) of the heart sounds in 2 subjects, one with a mean pulmonary artery pressure (PAp) of 12 mmHg (left) and the other with a mean PAp of 73 mmHg (right). In the bottom panel, it is hard to distinguish the subject with pulmonary artery hypertension from the subject with normal PAp. This contrasts with the bottom panel of Figure 5, in which the first sinusoid formant demonstrates a clear difference in frequency distribution. Top, normalized amplitude (Y-axis) plotted against time (X-axis); middle and bottom, frequency (Y-axis) plotted against time (X-axis).

