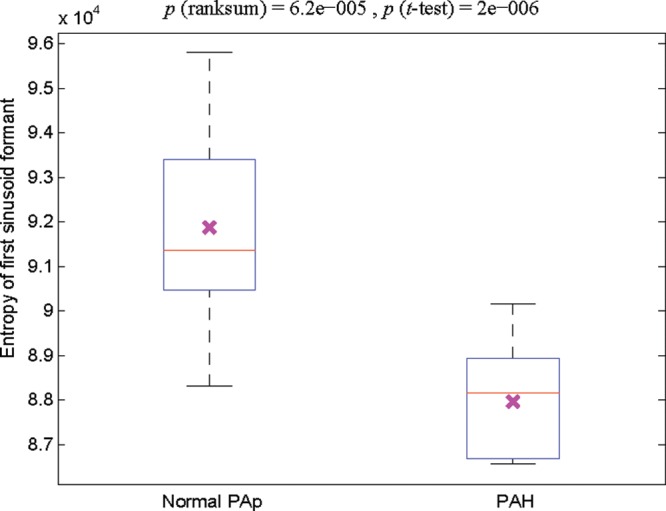
Figure 3.

Box plot of the entropy of the first sinusoid formant extracted from the heart sounds recorded at the second left intercostal space. The left-hand box represents the entropy from the heart sounds of children with a mean pulmonary artery pressure (PAp) of 8–24 mmHg (n = 13); the right-hand box represents that from the heart sounds of children with a mean PAp of 25–97 mmHg (i.e., with pulmonary artery hypertension [PAH]; n = 14). The cross in each box indicates the statistical mean. A two-sample t test was performed, and a significant (P < 0.05) difference was detected between subjects with a normal PAp and those with PAH. The red line indicates the median. The reported P values are uncorrected.
