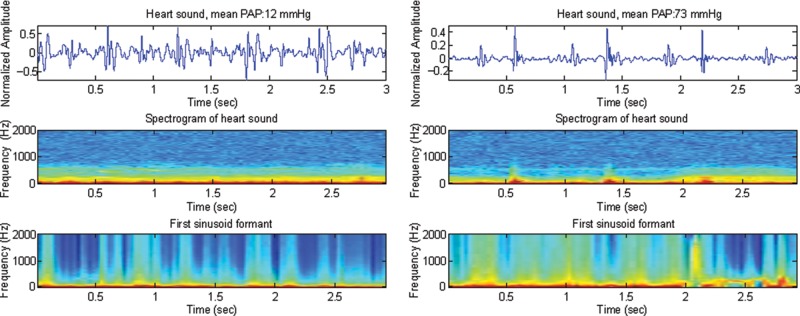
Figure 5.
Three-second duration of heart sound recording (top), spectrogram (middle), and the first sinusoid formant using the sine wave replica (bottom) in 2 subjects, one with mPAp = 12 mmHg (left) and the other with mPAp = 73 mmHg (right). Top, normalized amplitude (Y-axis) plotted against time (X-axis); middle and bottom, frequency (Y-axis) plotted against time (X-axis). In the bottom panel, there is a clear pattern in the frequency distribution representing low entropy in the subject with pulmonary artery hypertension (right). mPAp: mean pulmonary artery pressure.

