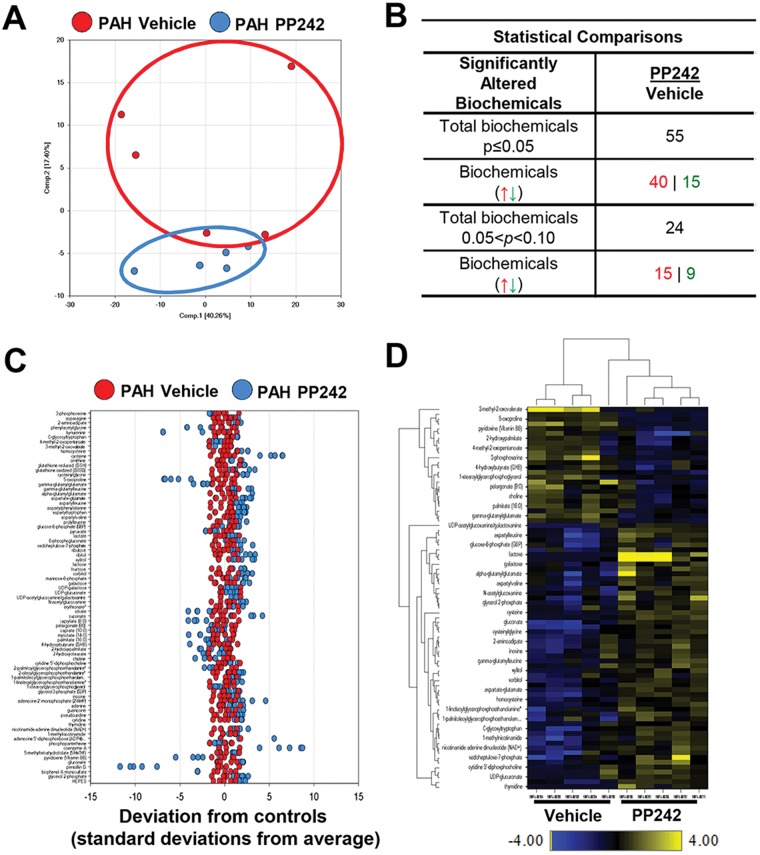
Figure 2.
Effect of mTOR inhibition on metabolomic profile of pulmonary arterial hypertension (PAH) pulmonary arterial vascular smooth muscle cells (PAVSMCs). A, Principal-component analysis of the total metabolites detected in PAH PAVSMCs treated with the small adenosine triphosphate–competitive mTOR inhibitor PP242 (blue) compared to vehicle-treated PAH PAVSMCs (red); 5 subjects/group. B, Significantly changed metabolites (P ≤ 0.05) and those approaching statistical significance (0.05 < P < 0.1) after PP242 treatment, compared to nontreated cells, by the Welch 2-sample t test. Arrows indicate upregulated (red) and downregulated (green) metabolites. C, A z-score plot of the 55 named metabolites differential between PP242-treated (blue) and vehicle-treated (red) groups, normalized to the mean of the control samples (5 subjects/group). D, Heat map showing relative levels of 55 differential metabolites in vehicle-treated (left) and PP242-treated (right) PAH PAVSMCs, arranged by unsupervised hierarchical clustering. Shades of yellow and blue represent an increase and decrease of a metabolite, respectively, related to the median metabolite levels. The heat map scale (bottom) ranges from −4 to +4 on a log2 scale. UDP: uridine diphosphate. mTOR: mammalian target of rapamycin.

