
Figure 4.
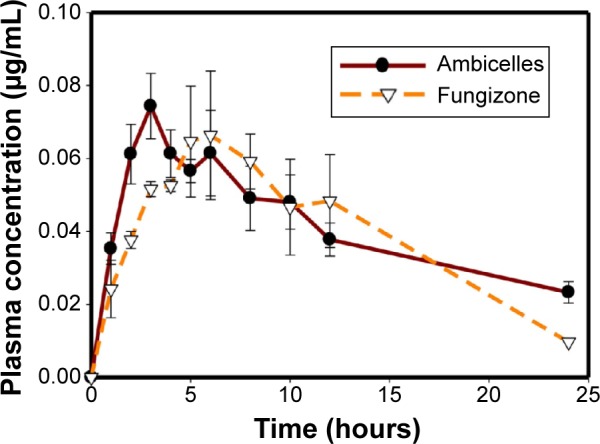
Plasma concentration–time curves of amphotericin B after oral administration of Fungizone® or Ambicelles (10 mg/kg) to rats.
Note: Each data point represents the mean ± standard deviation of three determinations (n=3).
Official websites use .gov
A
.gov website belongs to an official
government organization in the United States.
Secure .gov websites use HTTPS
A lock (
) or https:// means you've safely
connected to the .gov website. Share sensitive
information only on official, secure websites.
Plasma concentration–time curves of amphotericin B after oral administration of Fungizone® or Ambicelles (10 mg/kg) to rats.
Note: Each data point represents the mean ± standard deviation of three determinations (n=3).