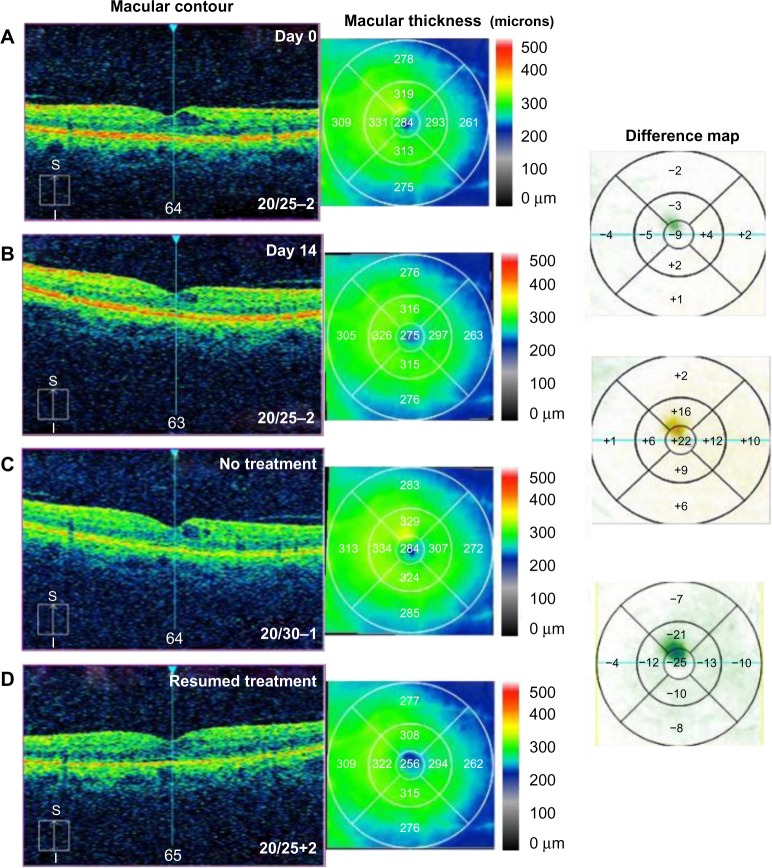
Figure 4.
Optical coherence tomography studies for case 4 (diabetic retinopathy).
Notes: (A) Macular contour and thickness at presentation. (B) Macular contour and thickness and macular change analysis 14 days following treatment. (C) Increased cystoid macular edema with cessation of treatment and (D) improvement with resumption of treatment.
Abbreviations: S, superior; I, inferior.

