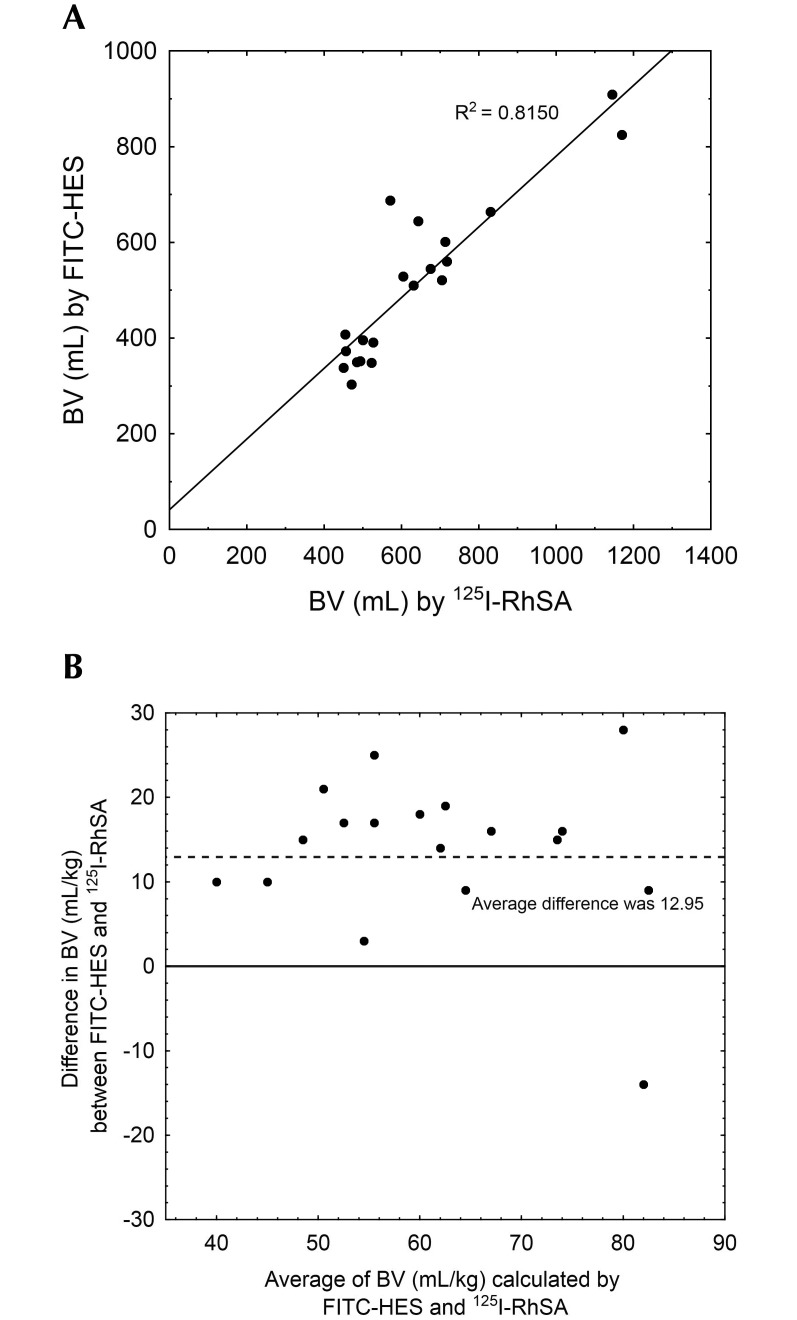
Figure 2.
(A) Correlation between BV (mL) amounts obtained using the 2 methods: FITC–HES and 125I-RhSA. (B) This Altman–Bland plot shows the difference relative to the average between the 2 methods of determining BV. The difference between the methods was consistent across the range of blood volumes in the study group. The average difference was 12.95 mL/kg, with bias toward a larger calculated BV with 125I-RhSA method.

