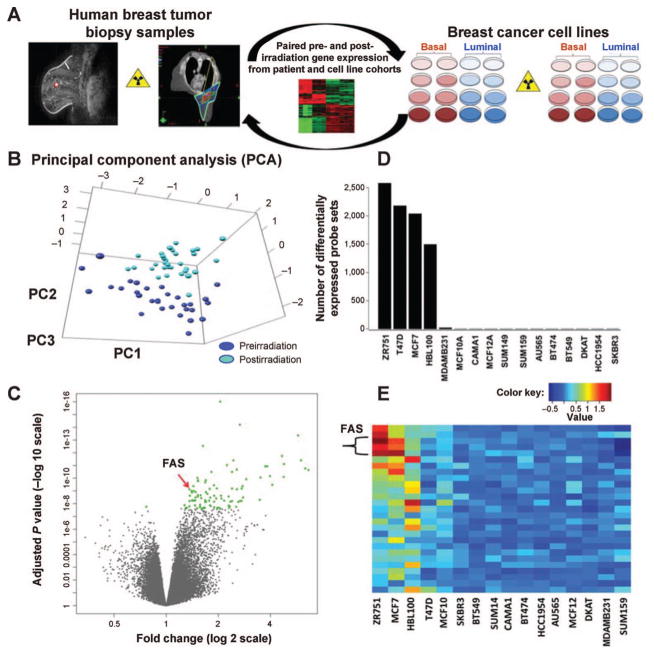
FIG. 1.
Response to radiation in paired pre- and postirradiation breast tumor samples and a panel of diverse breast cancer cell lines. Panel A: Overview schematic of research plan. Panel B: Principal component analysis on human breast cancers suggests that gene expression profiles after irradiation are significantly and consistently distinct from that noted prior to radiation. Panel C: Induction of gene expression dominates repression in these samples. The 100 genes with the most significant change in response to radiation are illustrated in green. Panel D: 16 cell lines representing diverse biologic phenotypes: luminal HER2− (MCF7, T47D, ZR751, CAMA-1), luminal-HER2+ (BT474, SKBR3, AU565), HER2+ (HCC1954) and basal (SUM149, SUM159, MDA-MB-231, MCF10A, MCF12A, BT549, HBL100 and DKAT) were evaluated for response to a single dose of 5 Gy. Four of the cell lines (3 HER2− luminal lines: MCF7, ZR751, T47D, and 1 basal: HBL100) had a large number of genes with significant induction or repression after irradiation. In contrast, the remaining twelve basal and HER2+ luminal cell lines revealed a striking absence of response to radiation. Panel E: Fourteen genes associated with 27 probe sets were identified as having significant Q values for differential expression in both the human data and in the cell line data (Q < 0.002). FAS is significantly induced with an effect conserved across multiple probe sets.

