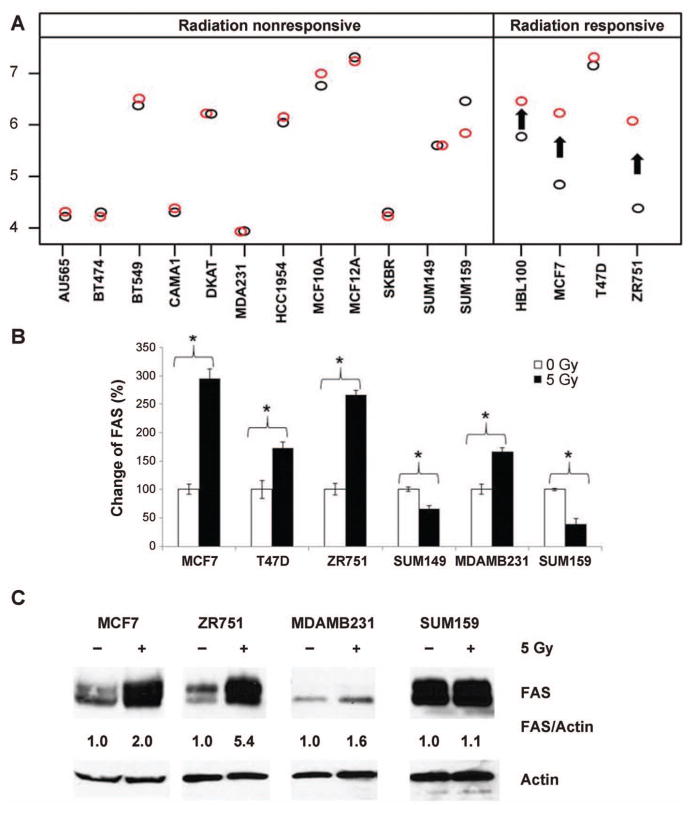
FIG. 3.
FAS response to radiation in breast cancer cell lines. Panel A: FAS induction is noted in 3 of the 4 radiation-responsive cell lines (black circles represent preirradiation gene expression; red circles represent postirradiation gene expression; arrows represent statistically significant findings). This is not seen in the nonresponsive cell lines, despite highly variable baseline levels of FAS. Panel B: qPCR confirms differential patterns of FAS response to radiation in phenotypically distinct cell lines (*P < 0.05). Panel C: At the protein level, FAS protein is again increased in the radiation-responsive (MCF7, ZR751) group and does not significantly change in the nonresponsive (MDAMB231, SUM159) cell lines. All results shown are for 24 h after a single dose of 5 Gy.

