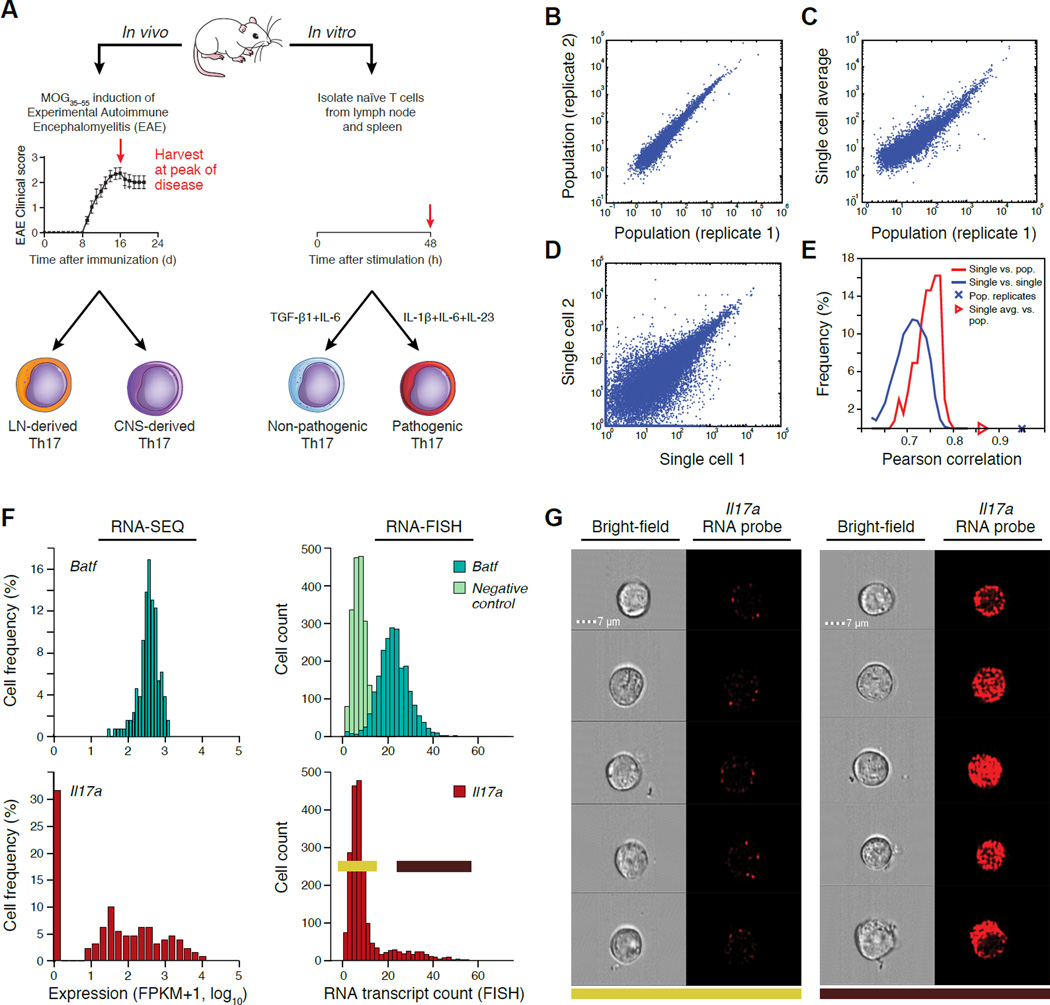
Figure 1. Single-cell RNA-seq of Th17 cells in vivo and in vitro.
(A) Experimental setup. (B–E) Quality of single-cell RNA-seq. Scatter plots (B–D) compare transcript expression (FPKM+1, log10) from the in vitro TGF-β1+IL-6 48hr condition, between two bulk population replicates (B), the ‘average’ of single-cell profile and a matched bulk population control (C), or two single cells (D). Histograms (E) depict the distributions of Pearson correlation coefficients (X axis) between single cells and their matched population control and between pairs of single cells. (F,G) Comparison to RNA Flow-FISH. (F) Expression distributions by RNA-seq and RNA Flow-FISH at 48h under the TGF-β1+IL-6 in vitro condition. Negative control: bacterial DapB gene. (G) Bright-field and fluorescence channel images of RNA Flow-FISH in negative (left) and positive (right) cells.

