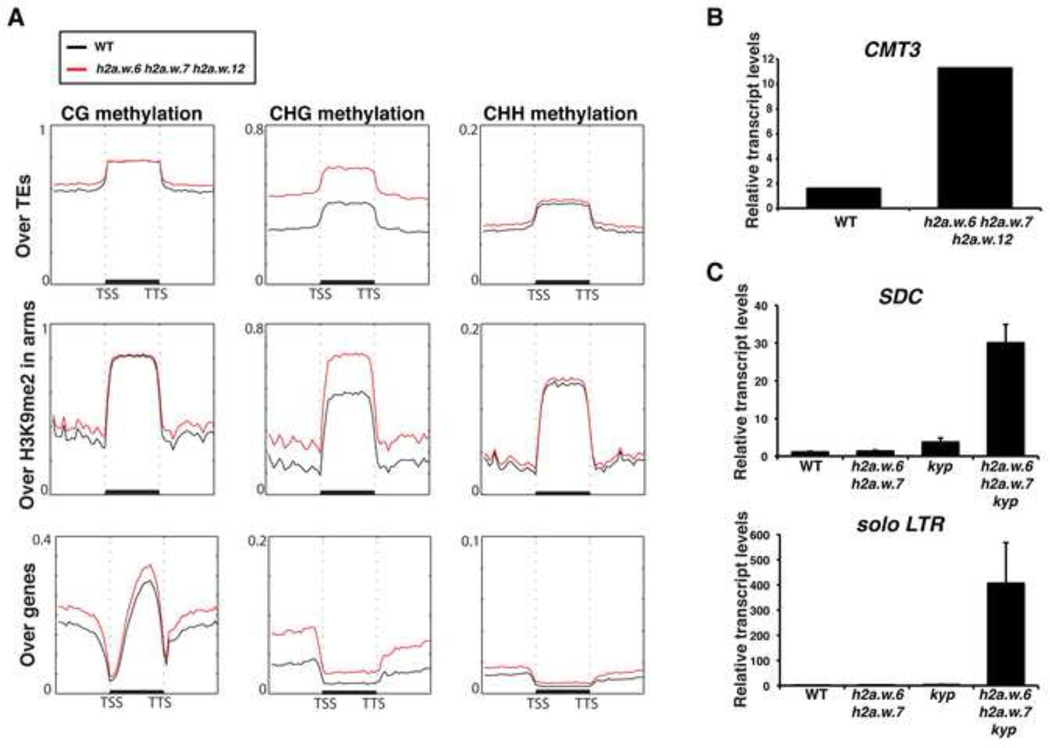
Figure 4. H2A.W represses the transcription of heterochromatic elements in synergy with methylation mediated by CMT3.
(A) Metaplot analysis from whole genome bisulfite sequencing showing different types of methylation levels in WT and h2a.w triple mutant over major genomic features. Graphs were plotted as in Figure 1A. (B) Expression levels of CMT3 in h2a.w triple mutant in comparison to WT. Expression values were obtained from RNA-seq data. (C) Expression levels of SDC and solo LTR in h2a.w.6 h2a.w.7 kyp mutant compared with WT. The data from quantitative real-time RT-PCR was normalized to ACTIN7. Error bars represent standard deviation based on three independent biological replicates. See also Figure S4.

