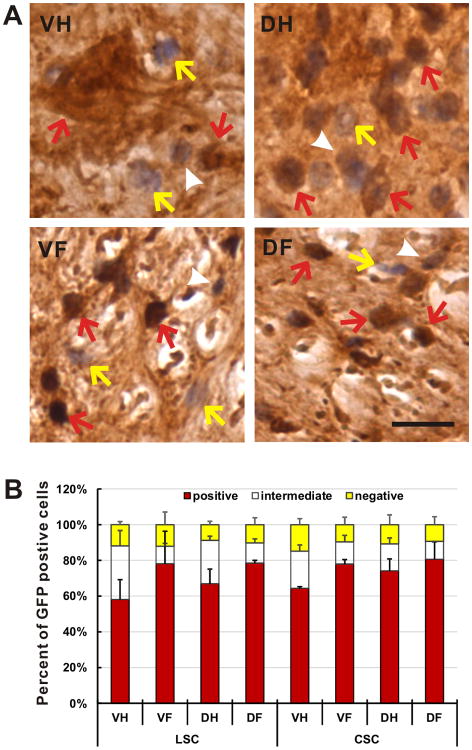
Fig. 3.
rAAVrh10 injected into the lumbar cistern transduced cells in the spinal cord with a high efficiency. (a) Spinal cord sections from animals with injection scores at 4 or 5 were immunostained with GFP antibody were counterstained with haematoxylin. The transduced and untransduced cells were counted and categorized into three groups: transduced (GFP-positive with dark brown signal, red arrows), possibly transduced (possible GFP-positive with light brown signal, white arrowheads) and untransduced (GFP-negative with no brown signal, yellow arrows). Bar = 30μm. (b) Approximately 60-90% of the cells were transduced in four representative areas of the lumbar and the cervical spinal cords. Bars represent the average of three animals. Yellow bars represent the fraction of GFP-negative cells (yellow arrows in a). White bars represent the fraction of possible GFP-positive cells (white arrowheads in a). Red bars represent the fraction of GFP-positive cells (red arrows in a). Error bars are standard deviation. VH = ventral horn, DH = dorsal horn, VF = ventral funiculus, DF = dorsal funiculus.

