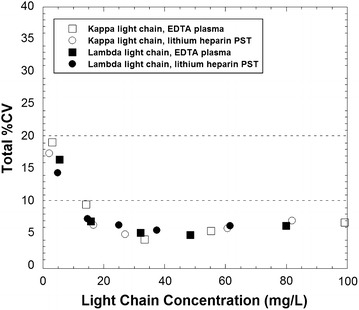
Fig. 1.

Precision profile of the total coefficient of variation (CV) estimated according to CLSI EP5-A2. Squares (open and filled) indicate kappa and lambda concentrations, respectively, using EDTA-plasma. Circles (open and filled) indicate kappa and lambda concentrations, respectively, using lithium heparin plasma separator tubes
