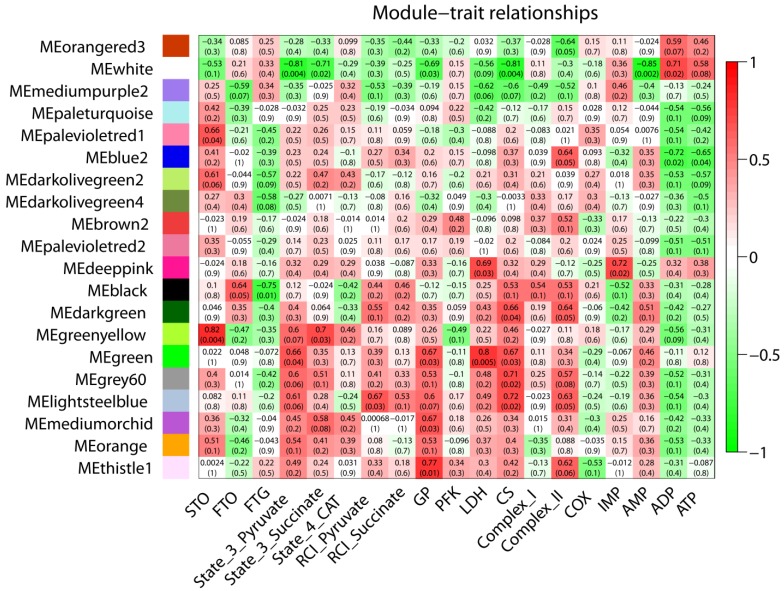
Figure 3.
Correlation matrix between each module and trait for PiNN pigs. Weighted gene co-expression network analysis (WGCNA) is used to group genes into 20 different modules based on their co-expression pattern. Each module is assigned arbitrarily to a color. The respective colors are shown on the left. The eigengene of each module, as a representative of the corresponding module, was tested for correlation with each trait. Shown are correlation coefficients (upper value) and the corresponding p-values (lower value). Cell color encodes correlation (red, positive correlation; green, negative correlation).

