Figure 3.
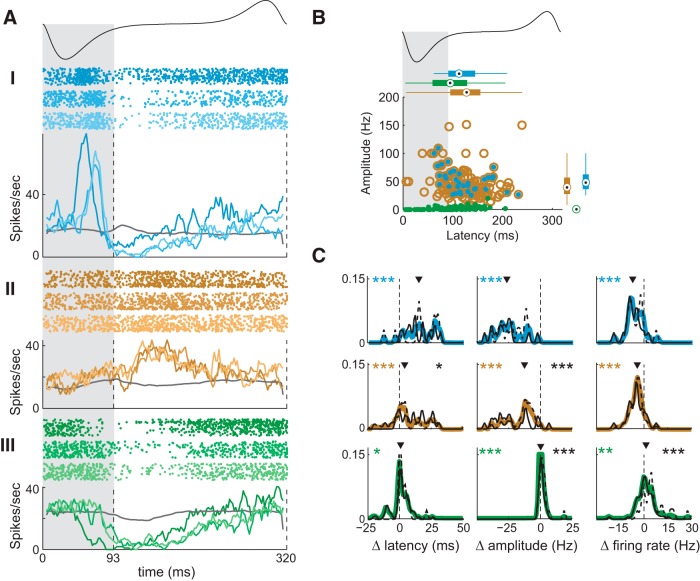
MTC responses change with repeated sampling. A, Sniff-warped raster and PSTH plots of sharp excitatory (I), excitatory (II), and inhibitory (III) responses of single MTCs during the first, fourth, and seventh sniff cycles (shown as color shades). A schematic of the sniff waveform is shown above the plots. Gray shading and vertical dashed lines delineate inhalation period. Gray trace, Activity of the mitral/tufted cell during unodorized sniffs. B, Scatter plot comparing amplitude and latency of excitatory, sharp, and inhibitory responses on the seventh sniff following odor onset. Boxplots show marginal response distributions, as in Figure 1C . Color conventions as in Figure 1. C, Colored lines are normalized distributions of changes in latency, amplitude, and firing rate of sharp, excitatory, and inhibitory responses with adaptation (difference between first and seventh sniffs). Black solid and dashed lines are the same distributions for early and late responses. Notations are same as in Figure 1D .

