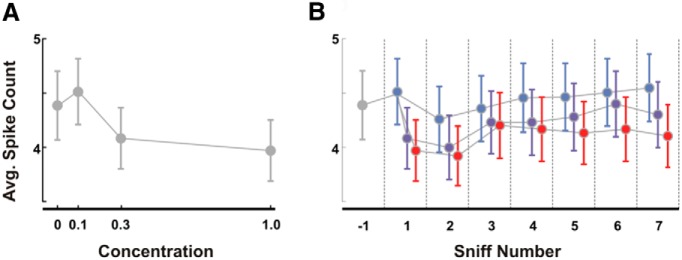
Figure 5.
Spike count unlikely to code odor intensity. A, Average number of spikes observed on a single sniff for each unit as a function of odor concentration. B, Average number of spikes per sniff per cell observed on each sniff for the three tested concentrations and baseline (gray, baseline; light blue, 0.1; dark blue, 0.3; red, 1.0). Error bars indicate the SD across trials.

