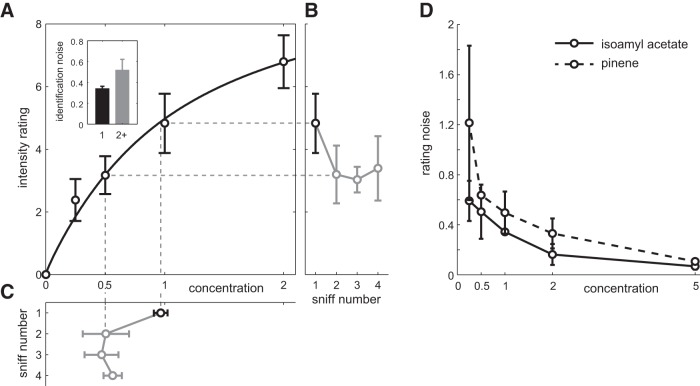
Figure 9.
Effect of adaptation on perceived odor intensity. A, Average intensity ratings for different concentrations of the odor pinene obtained on the first sniff (black) and after adaptation (gray). Curve denotes average Hill equation fit between concentration and perceived intensity. Concentration has been normalized such that concentration 1 corresponds to 60 ml/min saturated vapor diluted in a typical 2 s inhalation and a peak flow rate of 50 L/min (minimum 0.12% saturated vapor). Inset, Rating noise (rating SD/mean). B, Perceived intensity of the odor stimulus with concentration 1 across sniffs from a constant odor source. C, Equivalent concentration computed as the concentration with the same intensity rating on the first sniff extrapolated from the Hill equation fit for individual subjects (schematized by dashed gray lines). Error bars indicate the SD across subjects included in the analysis. D, Rating noise as a function of presented odor concentration for pinene (dashed) and isoamyl acetate (solid).

