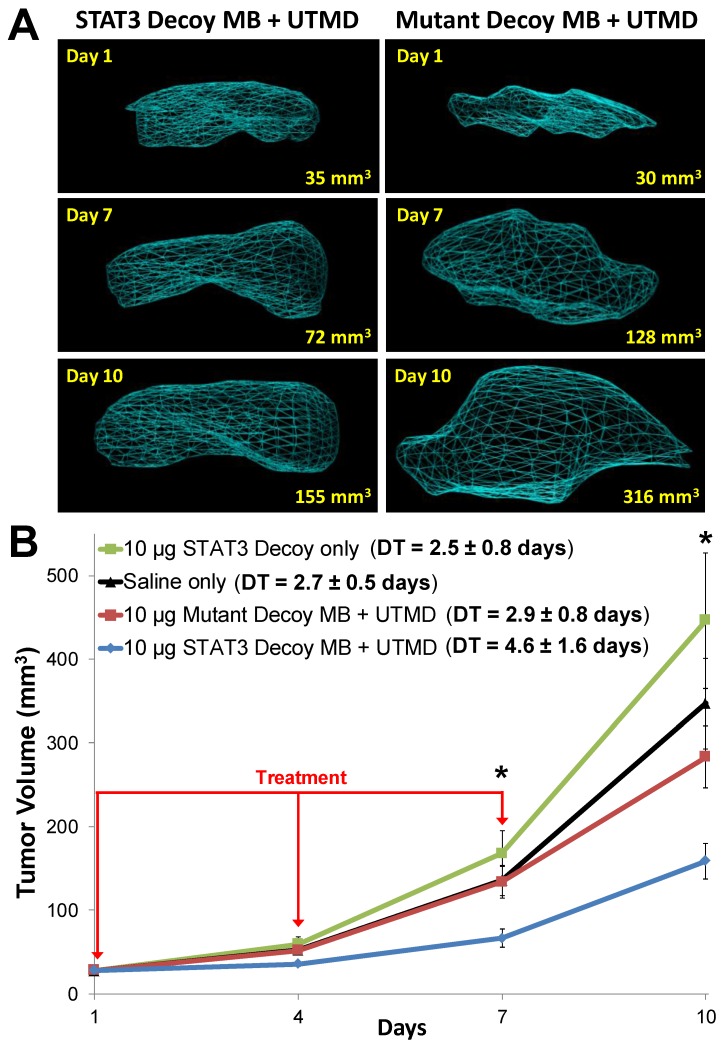
Figure 6.
(A) Representative 3D reconstructions of tumor volumes acquired using a high resolution ultrasound imaging system, indicating that tumor growth was blunted after treatment with STAT3 decoy MB + UTMD compared to mutant decoy MB + UTMD. (B) Tumor volume plotted as a function of time for each treatment group. Tumor growth was significantly inhibited after STAT3 decoy MB + UTMD treatment compared to control groups (ANOVA p = 0.003, N=6-8 per group). DT represents tumor doubling time. Asterisks (*) indicate ANOVA p < 0.05.

