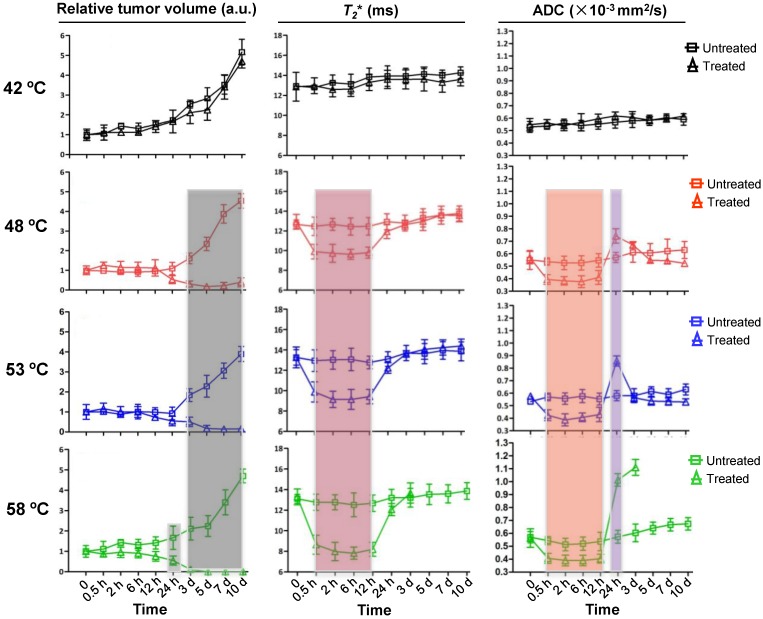
Fig 3.
Kinetics of changes in tumor volume, T2 values and ADC values without and with 15 min PTT at different temperatures. Left lane, normalized tumor volume calculated from MRI. Middle lane, kinetic of changes in T2 values from MRI. Right lane, kinetic of changes in ADC values from DW-MRI. The T2 and ADC values at 58 ºC were not presented due to the tumors were completely ablated 5 d after PTT. Data shown are mean ± S.E.M. (n=5/group. Gray area, p<0.05; red, orange and purple area, p<0.01 vs corresponding untreated tumor for that time point).

