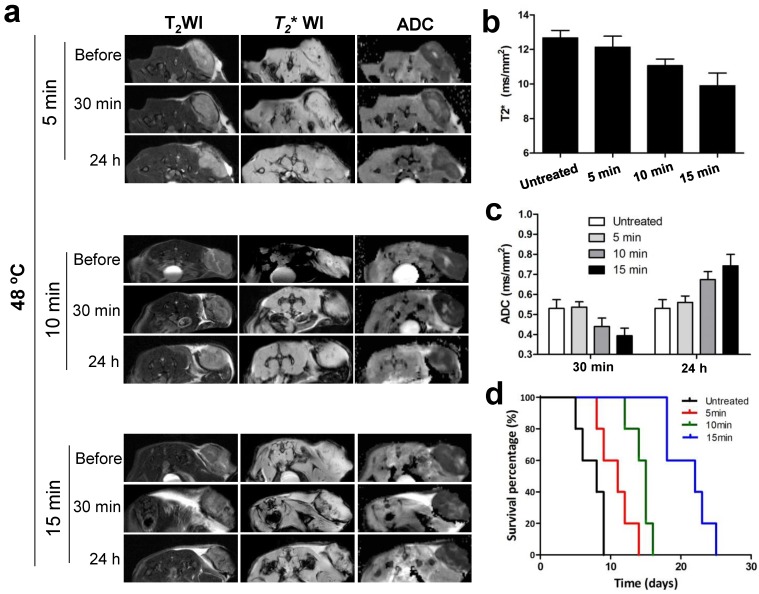
Fig 7.
In vivo MRI prediction and assessment of tumor therapeutic response to different PTT at 48 ºC. (a) Exemplary T2, T2* and ADC images of mice before and after three different PTT treatment durations of 5, 10, and 15 min, respectively. Quantification analysis of T2* values and ADC values from (a) were shown in (b) and (c), respectively. (d) Kaplan-Meier survival curves of untreated and treated mice with different PTT treatment durations (n=5/group).

