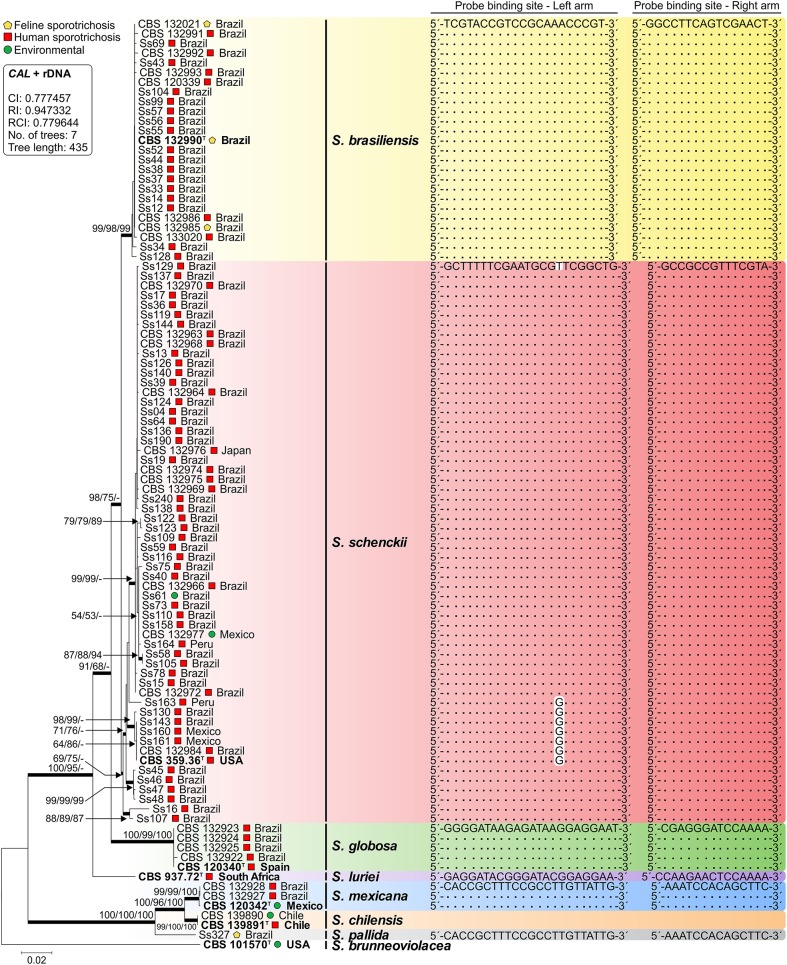
Figure 2.
Phylogenetic tree generated by neighbor joining, maximum likelihood, and maximum parsimony using partial nucleotide sequences of CAL and the rDNA operon (ITS1-5.8S-ITS2). Bootstrap values (1000 replicates) were added (denoted as neighbor joining/maximum likelihood/maximum parsimony). Bar, total nucleotide differences between taxa; T = type strain. The box contains statistics from maximum parsimony: CI, consistency index; RI, retention index; RCI, composite index (for all sites). Sequence conservation through a genetically diverse panel of Sporothrix for both left and right arms of each padlock probe is indicated. Further information about isolate sources appears in Table 1.

