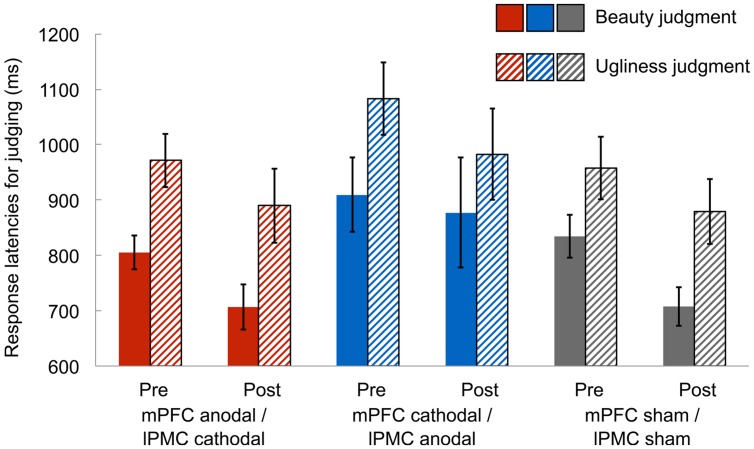
FIGURE 2.
Mean response latencies for judging beauty and ugliness in the pre-stimulation and post-stimulation session. In both the post-stimulation and the pre-stimulation sessions, the mean response latencies for judging beauty were shorter than those for judging ugliness in all groups, irrespective of the type of tDCS. Error bars represent standard errors (SEs) of the mean.

