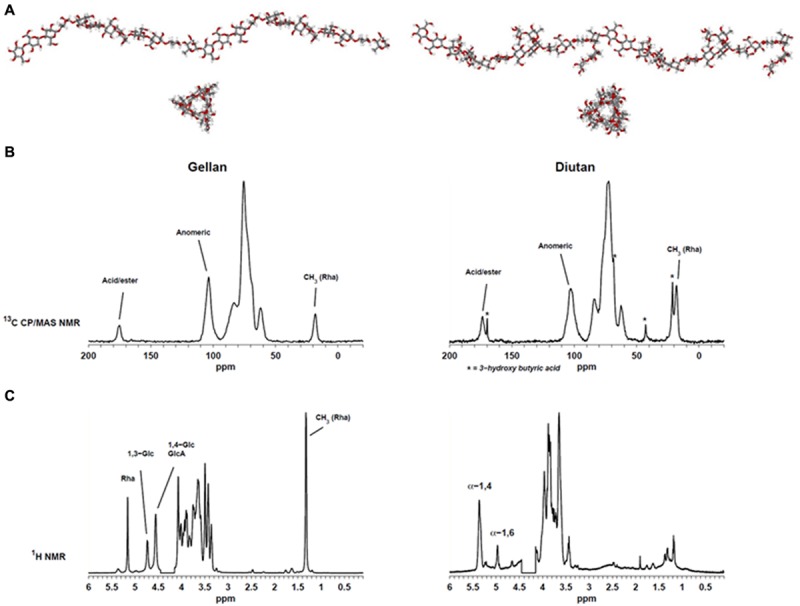
FIGURE 2.

(A) Molecular modeling of gellan (left) and diutan (right). (B) Solid-state 13C CP/MAS spectra of gellan (left) and diutan (right). (C) 1H Liquid-state Nuclear Magnetic Resonance (NMR) spectra of gellan (left) and diutan (right). The partly suppressed water resonance (4.15–4.45 ppm) was removed from the 1H Liquid-state NMR spectra.
