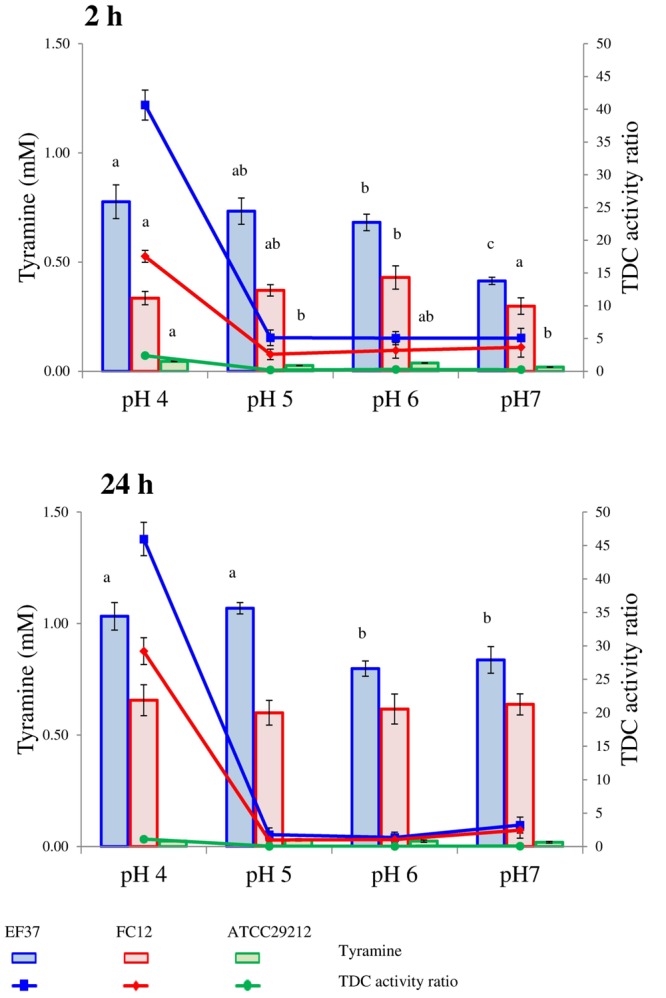
FIGURE 1.

Tyramine produced by enterococcal strains in phosphate/citrate buffer having different pH values after 2 and 24 h of incubation at 37°C. When ANOVA was significant (P ≤ 0.05) lower-case letters are reported. For the same strain, values with the same letter are not statistically different (P > 0.05) according to the post hoc comparisons of the ANOVA. In the same graphs also the TDC activity ratio is shown, i.e., the ratio of mM of tyramine accumulated by cells and mM of tyramine produced by commercial TDC pure enzyme (0.15 U/100 ml) in the same conditions.
