
Figure 3.
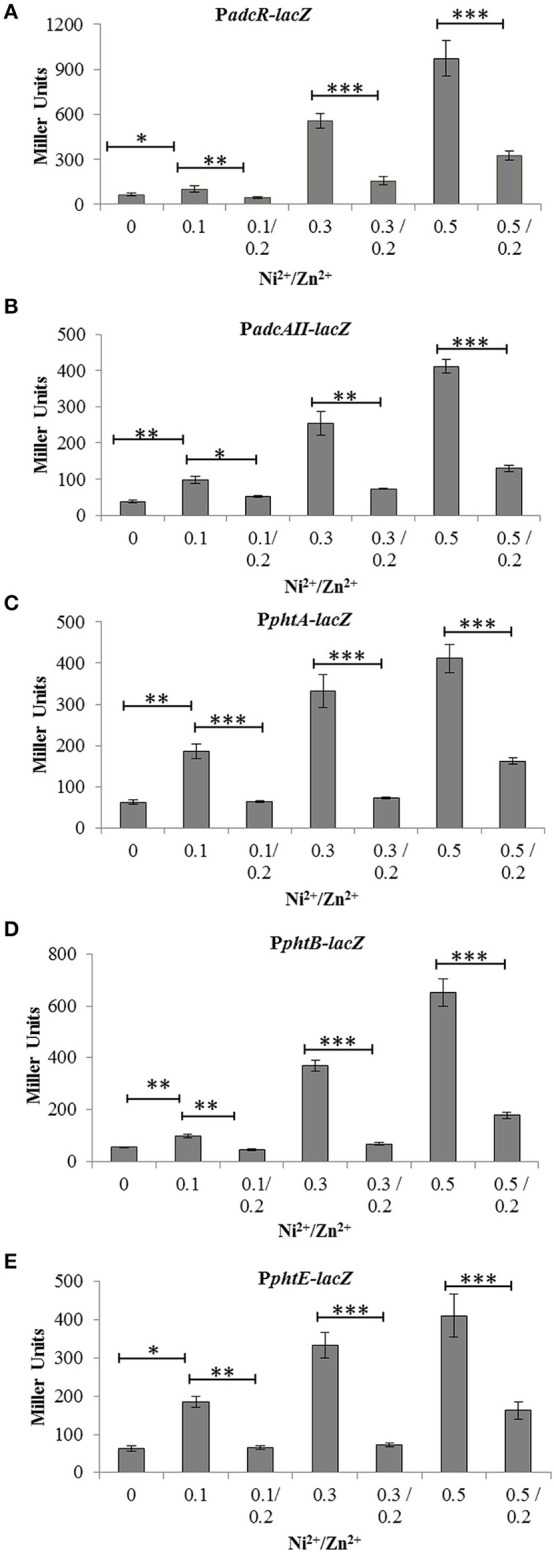
Expression level (in Miller units) of the D39 wild-type containing transcriptional lacZ-fusions to PadcR (A), PadcAII (B), PphtA (C), PphtB (D), and PphtE (E), grown in CDM with or without addition of different concentrations of Ni2+ and Zn2+. Standard deviation of three independent replications is indicated with error bars. Statistical significance of the differences in the expression levels was determined by One-way ANOVA (*P < 0.05, **P < 0.001, and ***P < 0.0001).