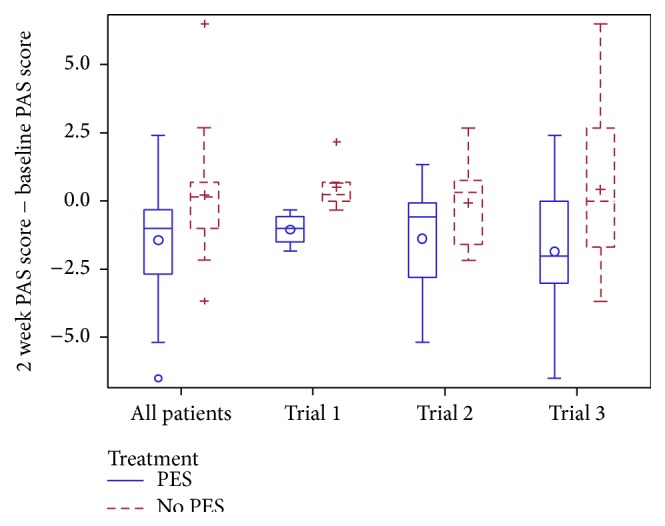
Figure 1.

Box and whisker plot of change in penetration aspiration score from baseline to two weeks, by source trial. Comparison of pharyngeal electrical stimulation (PES) versus no PES by multiple linear regression with adjustment, overall mean difference −0.9 (95% confidence interval −1.7, −0.1; p = 0.020); no difference between trials (p = 0.89).
