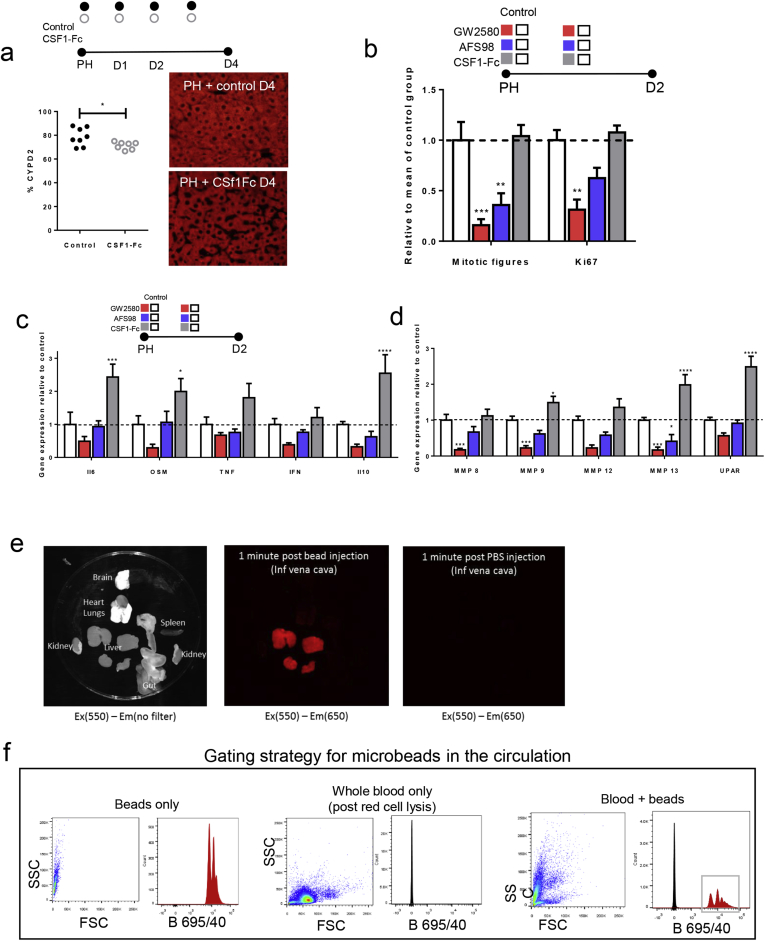
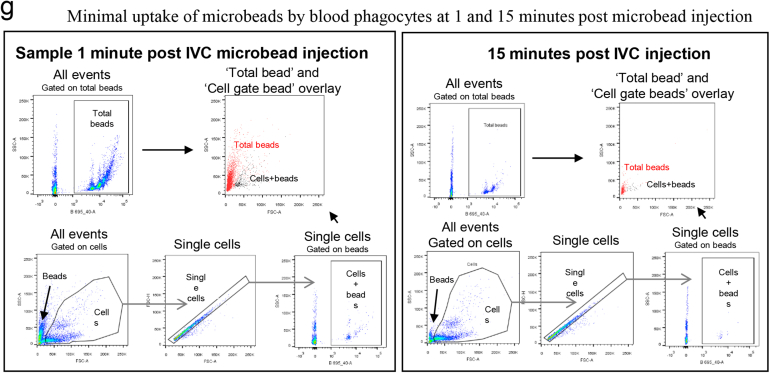
Supplementary Figure 5.
Supporting data for partial hepatectomy model. (A) Quantification CYPD2 immunofluorescence (red) per 20x HPF/mouse (control n=8; CSF1-Fc n=7; t test). (B) Number of mitotic figures and Ki67 positive hepatocytes per high powered field following following partial hepatectomy and either GW2580, AFS98 or CSF1-Fc administration versus control (vehicle gavage, rat IgG2a, PBS; n=8/group; 2-way ANOVA comparing intervention with relevant control, Bonferroni post hoc). (C) Hepatic gene cytokine expression at Day 2 following partial hepatectomy and either GW2580, AFS98 or CSF1-Fc administration versus control (vehicle gavage, rat IgG2a, PBS; n=8/group; 2-way ANOVA comparing intervention with relevant control, Bonferroni post hoc). (D) Hepatic MMP and UPAR (urokinase plasminogen activator) gene expression Day 2 following partial hepatectomy and either GW2580, AFS98 or CSF1-Fc administration versus control (vehicle gavage, rat IgG2a, CSF1-Fc; n=8/group; 2-way ANOVA comparing intervention with relevant control, Bonferroni post hoc). (E) Exvivo fluorescent imaging of organs 1 minute following injection of fluorescent micro beads in to the inferior vena cava. (F) Flow cytometry plots demonstrating bead and cell gating of blood samples following fluorescent microbead injection in to the inferior vena cava. (G) Representative flow plots of blood sampled from the inferior vena cava at 1 minute and 15 minutes following injection of fluorescent microbeads in to the circulation. Gating strategies including total fluorescent bead count (“Total beads”) and bead count with in blood cellular populations (“Cells + beads”). *P < .05, ** P < .01, *** P < .001, **** P < .0001.


