Supplementary Figure 6.
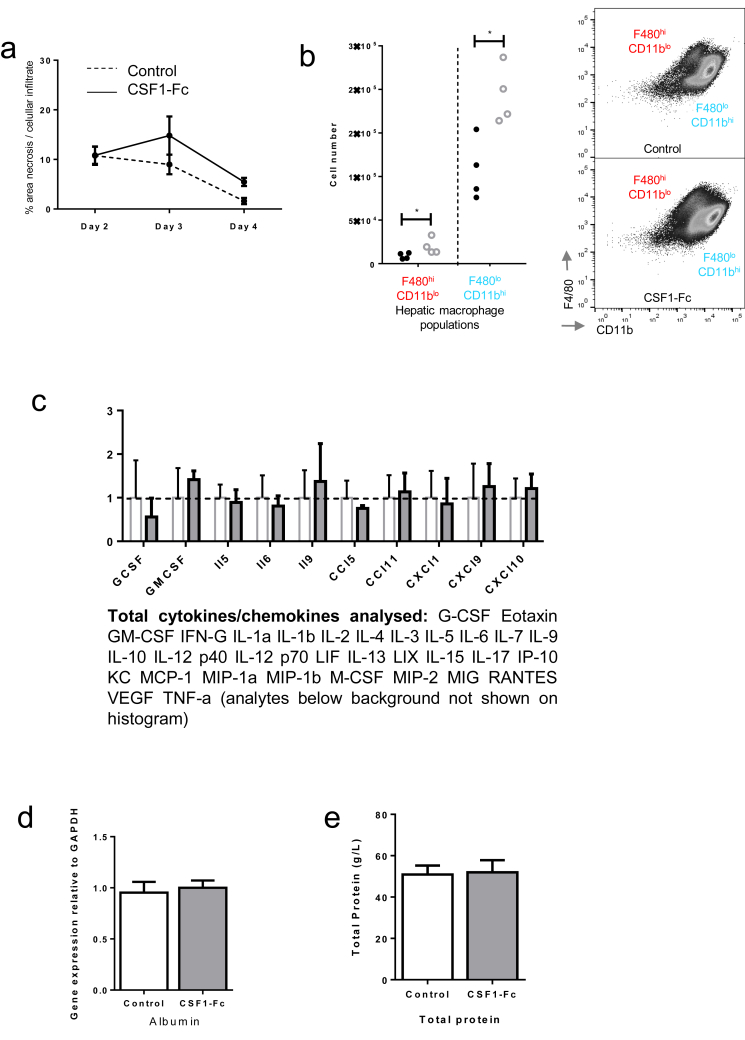
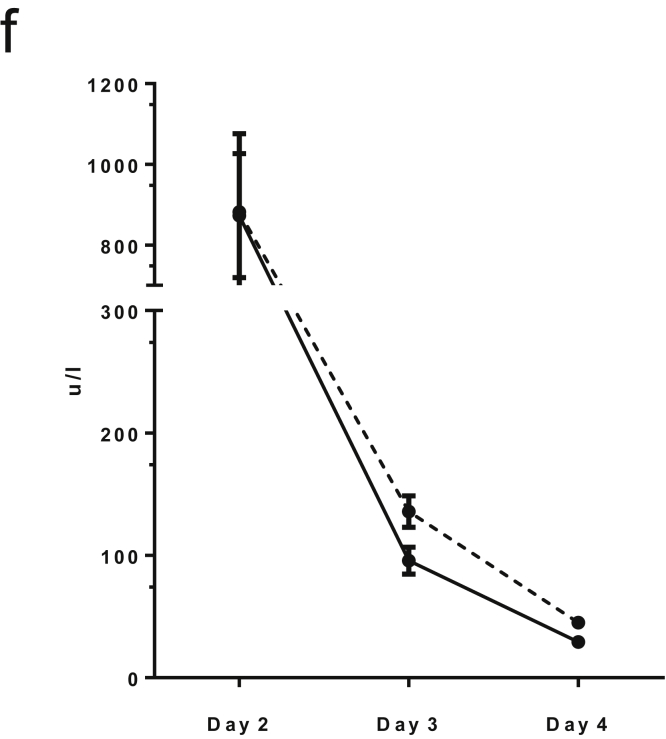
Supporting details for acetaminophen intoxication in mice, (A) Quantification of area of necrosis and cellular infiltrate at Day 2, 3 and 4 following acetaminophen intoxication. (B) Hepatic macrophage phenotype D3 following acetaminophen administration (F4/80+/CD11b- = resident macrophage population; F4/80-/CD11b+ = infiltrating macrophage population. (C) Serum cytokine array Day 4 following partial hepatectomy and either PBS control or CSF1-Fc treatment (2-way ANOVA and Bonferroni post hoc ns). (D) Hepatic albumin gene expression relative to GAPDH comparing control and CSF1-Fc treated mouse liver (n=8/group; t test ns). (E) Total protein concentration at D3. (F) Serum ALT following acetaminophen intoxication in control (dotted line) and CSF1-Fc treated (solid line) mice. *P < .05, ** P < .01, *** P < .001, **** P < .0001.


