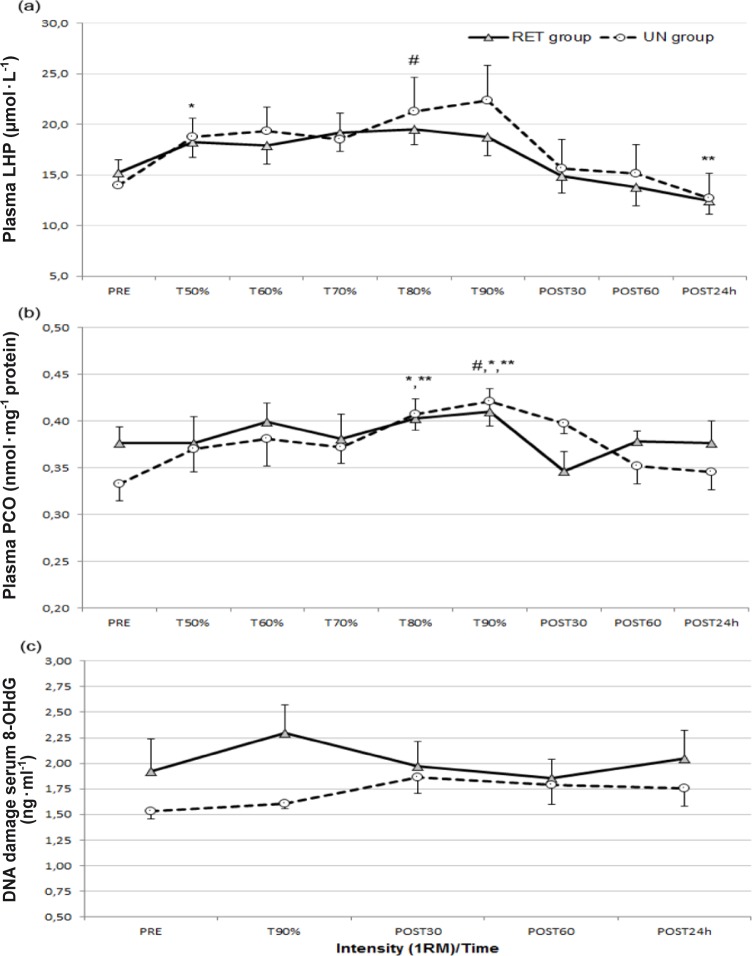
FIG. 2.
Oxidative stress biomarkers’ responses to progressive resistance exercise intensity (mean±SEM).
Note: RET – resistance-exercise trained, UN – untrained. (a): Lipid hydroperoxides (LHP) before (PRE) and after each intensity and in the recovery period; *p<0.05 significantly different from PRE value, **p<0.01 significantly different from T50%, T70%, T80%, and T90% values, #p<0.05 significantly different from POST 60 minute value. (b): Protein carbonyl (PCO) concentrations before (PRE) and after each intensity and in recovery period; *p<0.05 significantly different from POST 30 minute and POST 60 minute values, #p<0.05 significantly different from T50%, T60%, **p<0.01 significantly different from PRE, T70%, and POST 24 hour values. (c): DNA damage (8-OHdG) before (PRE) and after each intensity and in recovery period. No significant differences were observed.

