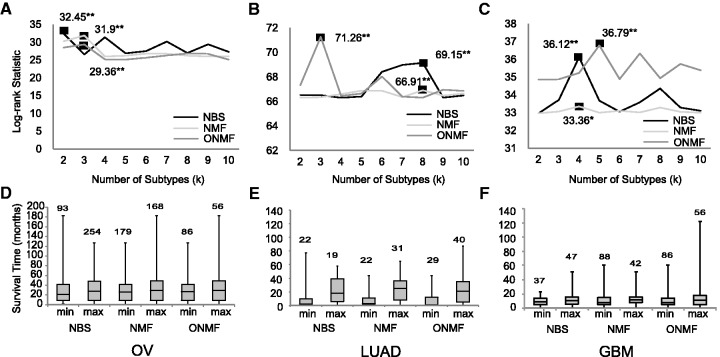
Fig. 2.
Association of cancer subtypes and patient survival time for OV, LUAD and GBM data. A,B and C show log-rank statistics with maximum values marked (P value of significance of for A (OV), for B (LUAD), and for C (GBM) is indicated by k number of stars). D, E and F show boxplots of subtypes with minimum and maximum median survival time. The numbers of subtypes analyzed are two for OV, eight for LUAD, and four for GBM

