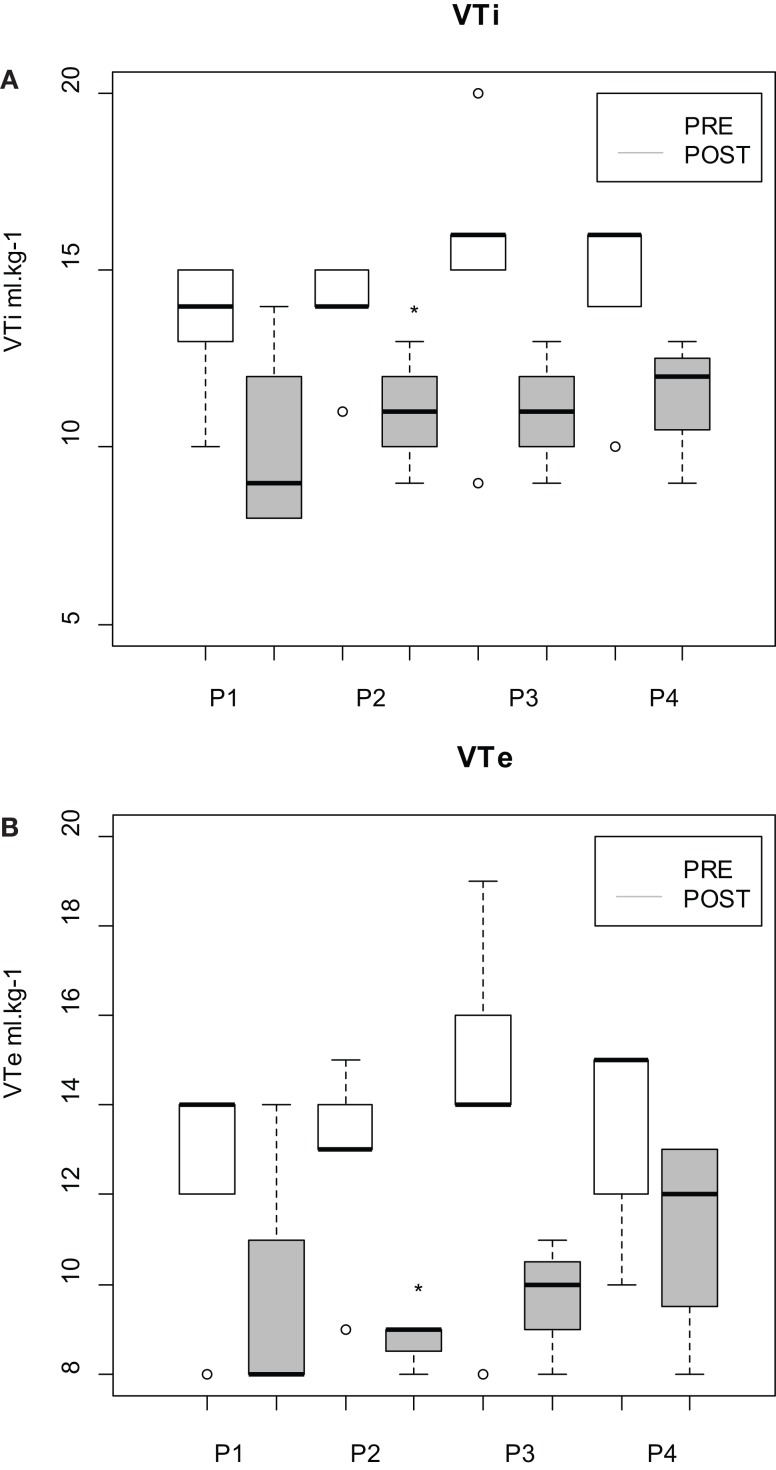
Figure 4.
(A) Inspired (i) and (B) expired (e) tidal volume (VT) measured in isoflurane-anesthetized horses undergoing fetlock arthroscopy. Horses received morphine and phenylbutazone before skin incision (PRE) or at the end of the procedure (POST). Four periods of time were defined: P1, from 30 to 15 min before skin incision; P2, from −15 min to skin incision; P3, from skin incision to 15 min after incision; and P4, from 15 to 30 min after skin incision. The boxplots represent the first and third quartile (Q1 and Q3, respectively) and the median. The lower dispersion bar represents, in the distribution, the value which is immediately superior to the adjacent value [Q1 − 1.5(Q3 − Q1)]. The higher dispersion bar represents, in the distribution, the value which is immediately inferior to the adjacent value [Q1 + 1.5(Q3 − Q1)]. *Indicates statistically significant differences between groups (p < 0.05).

