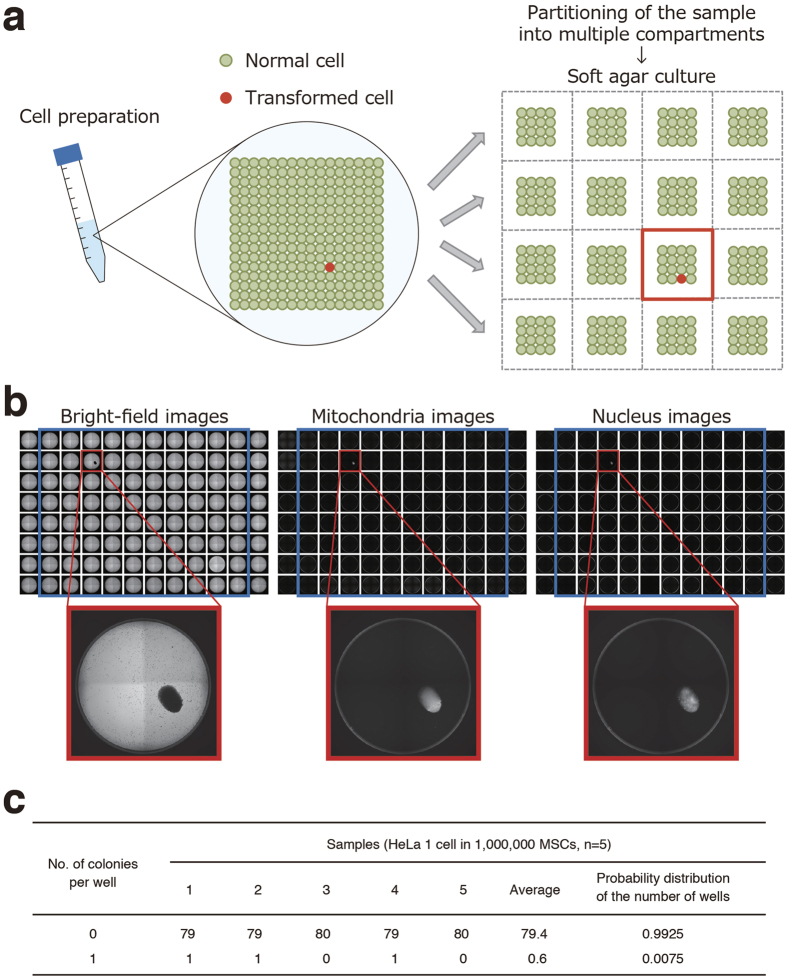
Figure 4. Digital analysis of soft agar colony formation for highly sensitive detection of a trace amount of transformed cells in hCTPs.
(a) Schema of digital analysis strategy of soft agar colony formation. The strategy consists of partitioning the cell preparation into multiple compartments and then detecting whether colony formation has occurred or not in a compartment. When we equally divide a cell preparation into multiple wells of cell culture plates, so that each well contains 0 or 1 transformed cell, the wells should either be “positive” or “negative” for colony formation. (b) A single HeLa cell was picked up from a Terasaki microwell with a micropipette under microscopic visualization and mixed in a suspension of hMSCs (one million cells). When the cell suspension was aliquoted into 80 wells of 96-well plates at a concentration of 0.0125 HeLa cells with 12,500 hMSCs per well and cultured in the soft agar media for 30 days, our colony screening system successfully detected only one “positive” well, indicating its ability to detect concentrations of HeLa cells as low as 0.0001% in hMSCs. Representative bright-field and fluorescent images (mitochondria and nucleus) of one detected colony are shown. (c) The probability distribution values of the number of wells from the observed values of five experiments are shown in a table. hCTPs, human cell-processed therapeutic products; hMSCs, human mesenchymal stem cells.

