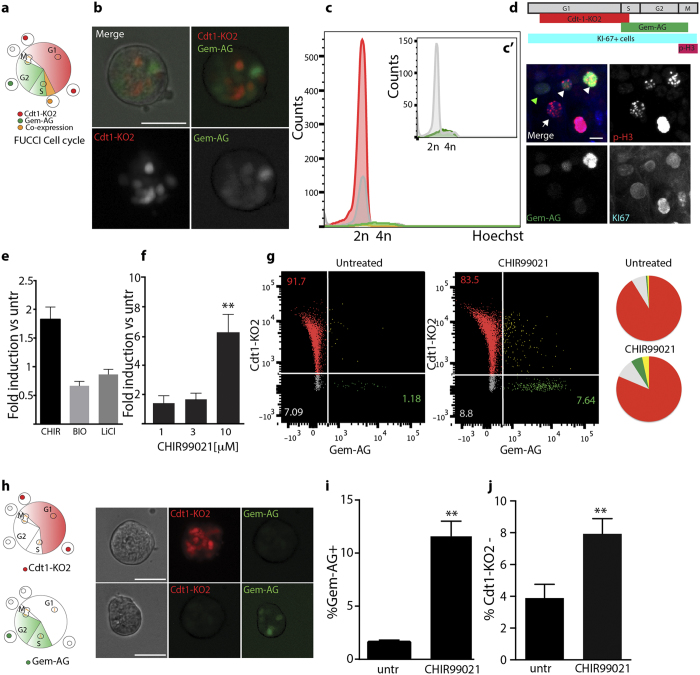
Figure 1.
(a) Schematic of the FUCCI reporter. Cell cycle phases are color coded according to the fluorescent-tagged reporters. (b) Representative example of otic sphere from double transgenic FUCCI animals. Scale bar 50 μm. (c) Cell cycle profile by DNA content analysis: Hoechst staining of dissociated cells derived from 5DIV otic spheres. Red: Hoechst histogram for Cdt1-KO2+cells. Green: for Gem-AG + cells, Yellow: for Gem-AG +/Cdt1-KO2+cells, Gray: for double negative cells. c’) Re-scale Histogram from Gem-AG + cells (green) and double negative cells (Gray) as in C. (d) Schematic of the temporal expression of the selected markers (top) and immunostaining of cells derived from Gem-AG FUCCI animals (bottom): Gem-AG (green), Ki67 (blue) and phospho-Histone 3 (red). PH3 +/Ki67 +/Gem-AG + (early-M) cells are indicated by the white arrow heads, PH3 +/Ki67 +/Gem-AG- (late-M) cells by the white arrow. PH3-/Ki67 +/Gem-AG + (S/G2) by green arrow, Scale bar 10 μm (e) Fold induction of total cell number compared to control sample. Cells are treated with 10 μM CHIR99021, 0.75 μm BIO or 10 mM LiCl at day 0 and harvested at day 5 (Mean +/− SEM, Wilcoxon Paired test (ns) n = 4). (f) Fold induction of total cell number compared to control sample. Primary spheres were cultured for 5 days in presence of different concentrations of CHIR99021 (Mean +/− SEM **P < 0.01 Wilcoxon Paired test. (n = 3 for 1 μM, n = 3 for 3 μM and n = 9 for 10 μM and control). CHIR99021 was added at day 0 and day 3. (g) Flow cytometric analysis of FUCCI spheres treated with CHIR99021 for 5 days. The percentage of each population is indicated in the quadrants. (For Gem-AG + cells, the percentage reported is the sum of Gem-AG +/Cdt1-KO2- and Gem-AG +/Cdt1-KO2 + ). Pie charts show the distribution of cells in the 4 populations. Color code according to the FUCCI reporter. (h) Schematic of the cell cycle of Cdt1-KO2 single positive (top) and Gem-AG single positive (bottom) cells and representative example of otic spheres derived from single transgenic animals at day 5 in untreated conditions. Scale bar 50 μm. (i) Quantification of Gem-AG + cells (n = 4) and (j) Cdt1-KO2- cells (n = 11) in single transgenic lines after 5 days in vitro in presence/absence of 10 μM CHIR99021. (Values are Mean +/− SEM **P < 0.01 Paired t test).

