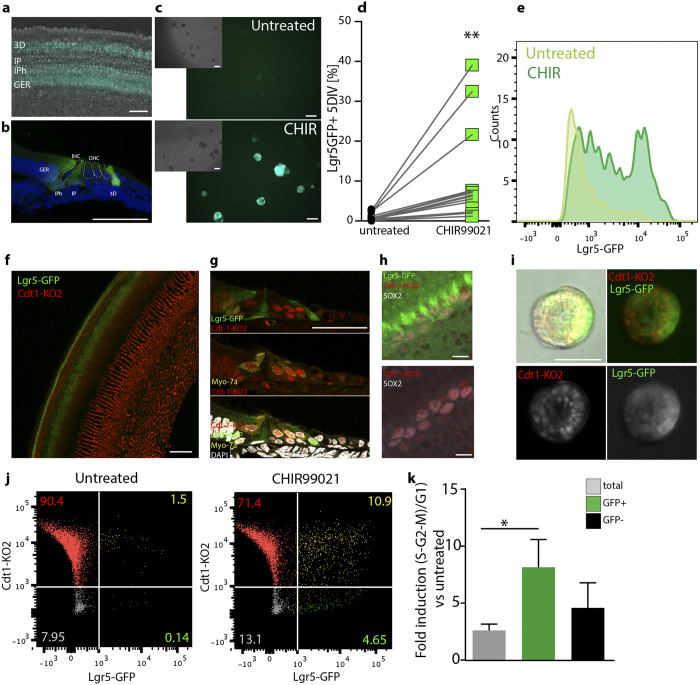
Figure 2.
(a) Organ of Corti whole mount from Lgr5-GFP transgenic animals at isolation. Scale bar 50 μm (b) Representative image of a cryosectioned Lgr5-GFP + OC from p5 animals. Scale bar 50 μm (c) Otic spheres derived from Lgr5-GFP animals after 5 days in culture in presence (bottom) /absence (top) of 10 μM CHIR99021. Inserts show the bright field image. Scale bar 100 μm (d) Quantification of Lgr5-GFP + cells by flow cytometry from day 5 otic spheres. (**p < 0.05 Paired t test, n = 14 independent experiments) (e) Representative example of GFP expression analyzed by flow cytometry of otic spheres cultured for 5 days in presence/absence of 10 μM CHIR99021. (f) Organ of Corti at isolation from Cdt1-KO2/Lgr5-GFP animals. Scale bar 50 μm (g) Representative image of Cdt1-KO2/Lgr5-GFP cochlea from p5 Tg animals immunostained for MyoVIIa (yellow) and counterstained with DAPI (white). Lgr5-GFP (green), Cdt1-KO2 (red). Scale bar 50 μm. (h) Confocal image of Cdt1-KO2/Lgr5-GFP OC immunostained for Sox2 (white). The area selected corresponds to the 3rd row of Deiters’ cells and Hensen’s cells region. Scale bar 10 μm (i) Otic spheres derived from double Tg animals at day 5, (untreated). Scale bar 50 μm. (j) Flow cytometry quantification of cell cycle profile in Cdt1-KO2/Lgr5-GFP. (h) Quantification of the ratio between Cdt1-KO2 negative cells and Cdt1-KO2 positive cells in the total, Lgr5-GFP + and GFP negative population. Fold induction relative to the untreated samples is shown (Mean +/− SEM * = p < 0.05 n = 5. Kruskal-Wallis test with Dunn’s correction).

