Figure 4.
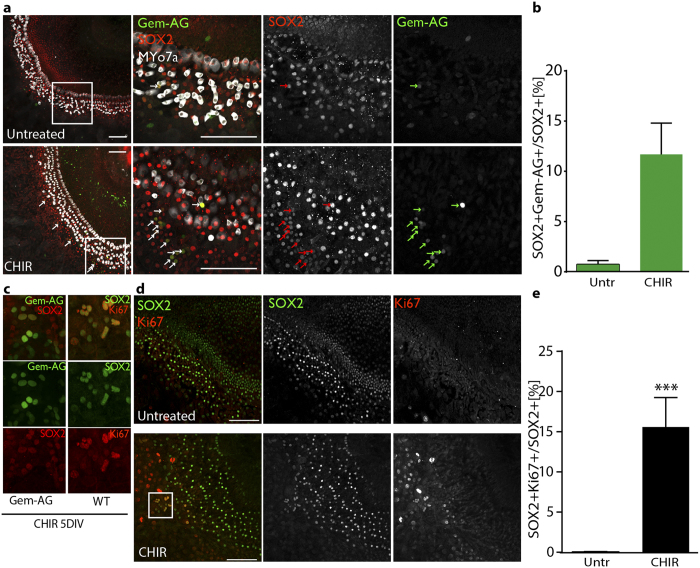
(a) Confocal imaging (maximum Z stack projections) of organotypic cultures of FUCCI Gem-AG organ of Corti (5 days in vitro) from p5 animals, (Middle turn regions are shown) untreated or CHIR99021 treated. Merge and single channels are displayed: Gem-AG (green), MyoVIIa (white), Sox2 (red). Arrows indicated double positive cells. Scale bar 100 μm (b) Quantification of double positive (Gem-AG +/Sox2 + relative to the total Sox2+cells counted). OC from 3 animals were imaged by confocal microscopy. 10 different fields were imaged from basal to apex per OC and a total number of ca. 2000 Sox2+cells was counted. Values are Mean +/− SEM (c) Higher magnification of double positive cells Gem-AG +/Sox2 + (left) or Ki67/Sox2 + (right). (d) Confocal imaging (maximum Z stack projections) of organotypic cultures of WT organ of Corti (5 days in vitro), from p5 animals (Middle turn regions are shown) untreated or CHIR99021 treated. Merge and single channels are displayed: Ki67 (red), Sox2 (green). Scale bar 100 μm. White boxed area is enlarged in 4c (e) Quantification of double positive cells (Ki67 +/Sox2 + relative to the total Sox2+cells counted). OC from 5 animals (age p5) were imaged by confocal microscopy. 10 different fields were imaged from basal to apex for each OC and a total number of ca. 6000 Sox2 cells was counted per condition. Values are Mean +/− SEM ***p < 0.001 Wilcoxon paired test.

