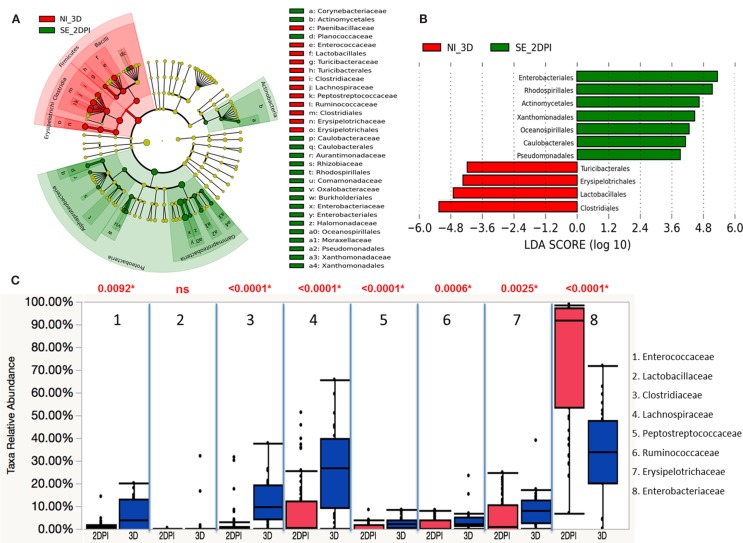
Figure 11.
Differential abundances of cecal microbial communities between infected and non-infected group at 2 DPI. (A) Taxonomic cladogram generated from LefSe analysis showing significant difference in microbiota profile of non-infected (red) and S. Enteritidis-infected (green) at early days post infection (2 DPI). (B) Differently abundant taxa detected with cut-off value of linear discriminant analysis (LDA) score >2.0. Non-infected enriched taxa are indicated with negative LDA score (red) and taxa enriched in S. Enteritidis-infected have positive LDA score (green). (C) Comparison of relative abundance levels of cecal microbiota at family level in treatment group was evaluated. The boxplot shows the quartiles above and below the median with dark line at center of the box denoting median, black dots showing the outlier. The respective p value for each family group is reported using Wilcoxon rank sum test. Abbreviation: NI_3 D, non-infected chicks at 3 days old; SE_2 DPI, S. Enteritidis-infected chicks at 2 days post infection.

