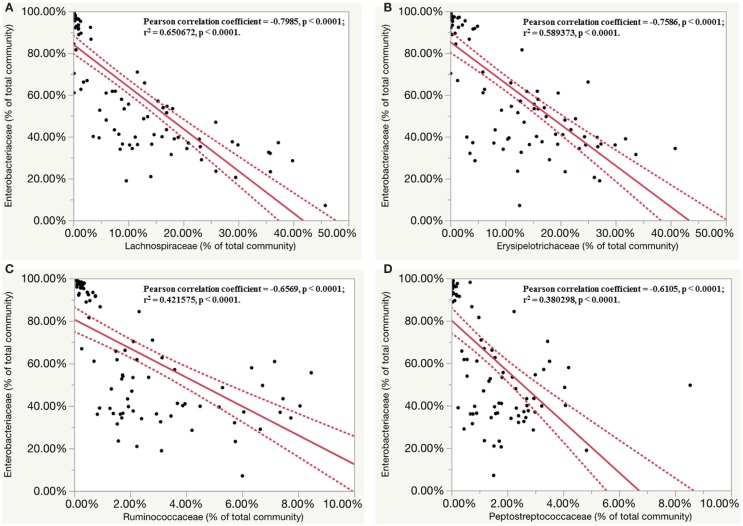
Figure 7.
Inverse correlation between relative abundance of members of Enterobacteriaceae family with other four major family groups. Dashed line indicated 95% confidence intervals. (A) Linear regression plots of relative abundance of bacteria (% of total community) belonging to Enterobacteriaceae family and Lachnospiraceae family in S. Enteritidis-infected group. (B) Linear regression plots of relative abundance of bacteria belonging to Enterobacteriaceae family and Erysipelotrichaceae family in S. Enteritidis-infected group. (C) Linear regression plots of relative abundance of bacteria belonging to Enterobacteriaceae family and Ruminococcaceae family in S. Enteritidis-infected group. (D) Linear regression plots of relative abundance of bacteria belonging to Enterobacteriaceae family and Peptostreptococcaceae family in S. Enteritidis-infected group.

