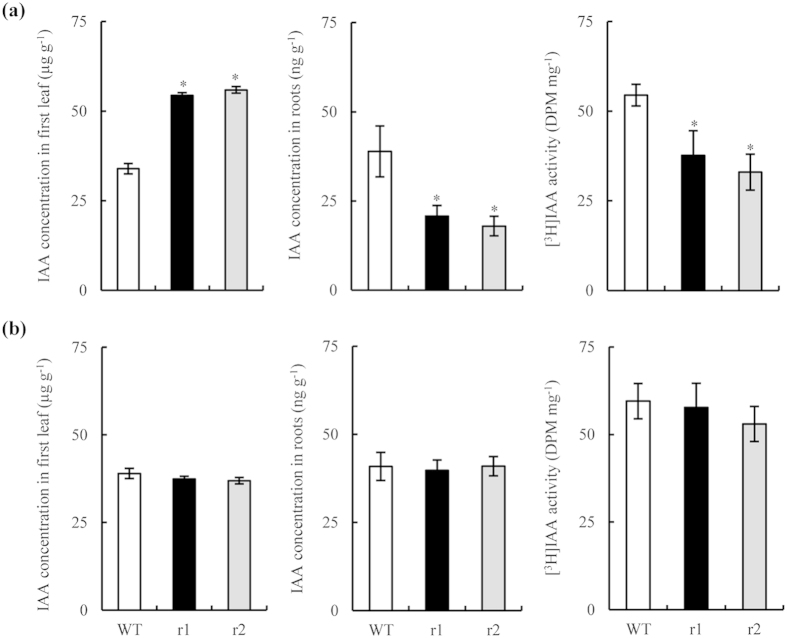
Figure 6. IAA concentration in the first leaf and roots and [3H]IAA transport in wild-type (WT) and osnar2.1 knockdown lines (r1 and r2).
Seedlings were grown hydroponically for 1 wk in nutrient solution containing 0.2 mM NO3− (a) or NH4+ (b). Values are means ± SE (n = 6). *P < 0.05 (ANOVA) comparing WT plants and two mutant lines.

