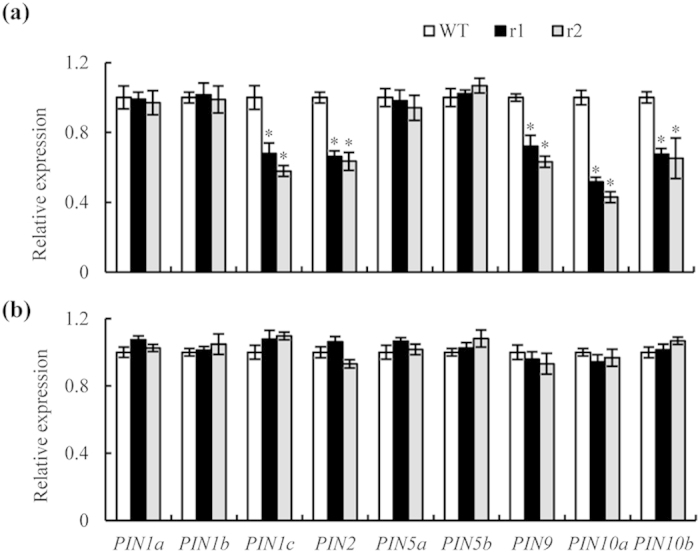
Figure 8. qRT-PCR analysis of PIN family genes in wild-type (WT) and osnar2.1 knockdown lines (r1 and r2).

Seedlings were grown hydroponically for 1 wk in nutrient solution containing 0.2 mM NO3− or NH4+. (a,b) Expression levels in medium containing (a) 0.2 mM NO3− or (b) 0.2 mM NH4+. Relative mRNA levels for individual genes were normalised relative to OsACT. Values are means ± SE (n = 4). *P < 0.05 (ANOVA) comparing expression levels of the same gene in WT plants and two mutant lines.
