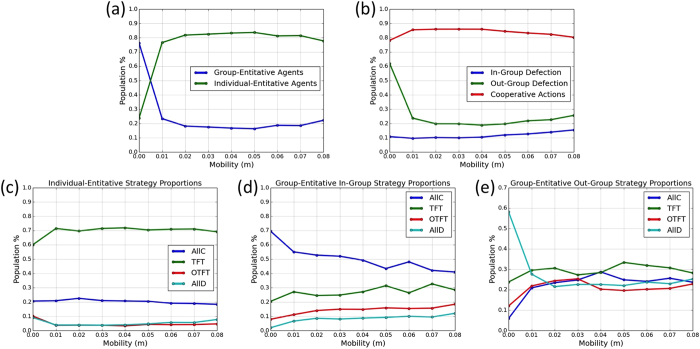
Figure 2. Proportions of actions and strategies as a function of mobility, after 30,000 iterations.
Each data point is an average of 100 simulation runs. The plots show the proportions of (a) the group-entitative and individual-entitative agents, (b) the actions played by the agents, (c) the strategies of the individual-entitative agents, and (d) the in-group and (e) out-group strategies of the group-entitative agents.

