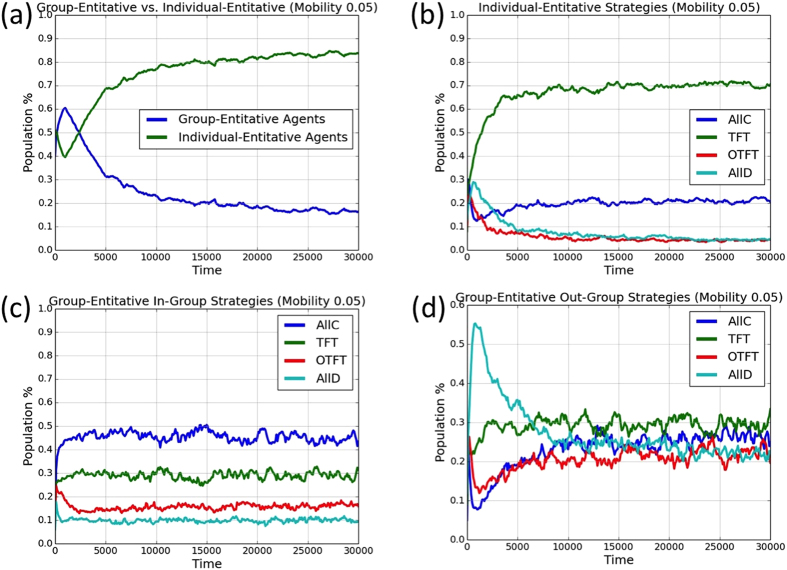
Figure 5. Single simulation run for 30000 generations with mobility probability m = 0.05.
(a) Proportions of group-entitative and individual-entitative agents. (b) Relative proportions of the individual-entitative agents’ strategies; Relative proportions of the group-entitative agents’ (c) in-group and (d) out-group strategies.

