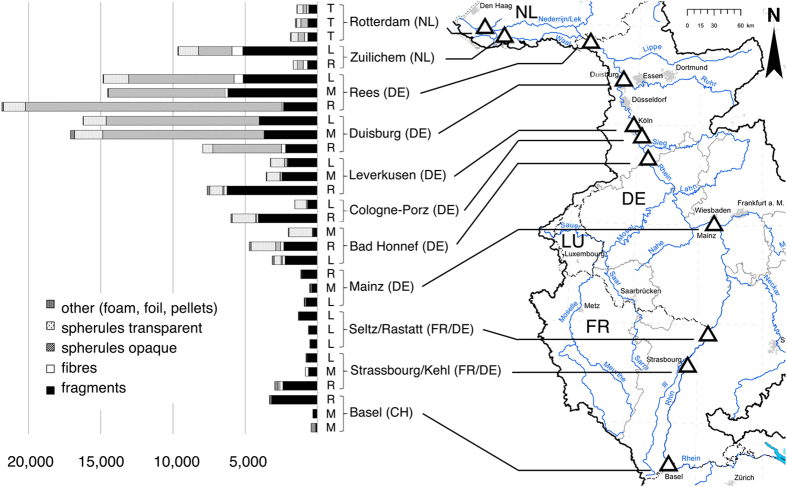
Figure 1. Number of microplastic particles (300 μm−5 mm) 1000 m−3 in categories at all sampling sites (Δ).
The horizontal columns present microplastic abundance 1000 m−3 and the respective fraction of categories. L: left bank, M: mid-river, R: right bank, T: transect (position in the river cross section). The figure was created using Adobe Photoshop CS4, Version 11.0.2 to assemble the columns (Microsoft Excel for Mac 2011, Version 14.4.8) and the map (intern map by the ICPR Secretariat, 201144; modified).

