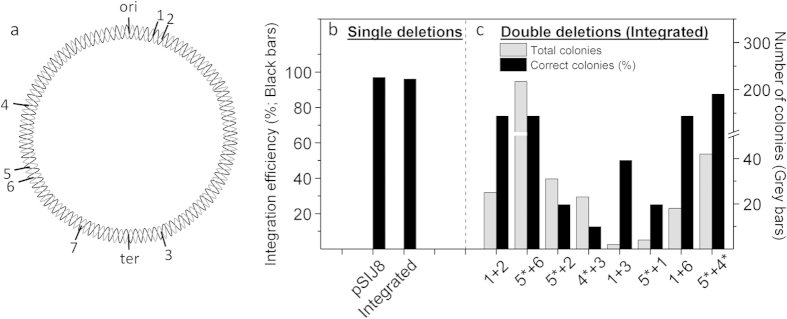
Figure 2. Integration efficiency.
(a) Genomic location of the different genes targeted for deletion in this study. 1. rfe. 2. typA; 3. yciW; 4. ptsP*; 5. evgA*; 6. ackA; 7. yobF (* indicates that the deletion cassette was targeted with both phosphorothioated and phosphorylated primers). (b) Efficiency of single deletions using either pSIJ8 or the integrated system in strain SIJ488 (n > 200). (c) Efficiency of deletion of two genes during one round of electroporation. Grey bars indicate the total number of colonies obtained; black bars indicate the percentage of correct colonies (n~8, see text).

