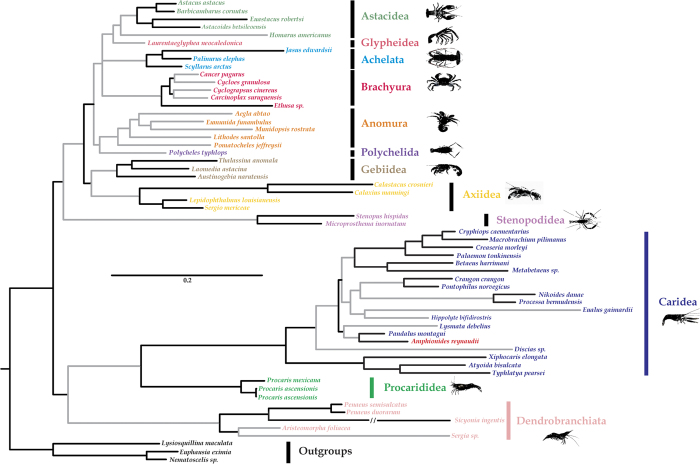
Figure 2. Bayesian phylogram for Amphionides reynaudii and selected decapods.
Euphausiacea and Stomatopoda are used as outgroups, tree based on the concatenated dataset of 16 S rRNA, 18S rRNA, 28S rRNA and H3 genes. Nodes with Bayesian posterior probabilities >0.95 and maximum likelihood bootstrap values >75 are indicated as dark branches versus the other nodes with lower support values as grey branches.

